Data · FHFA
Home price change
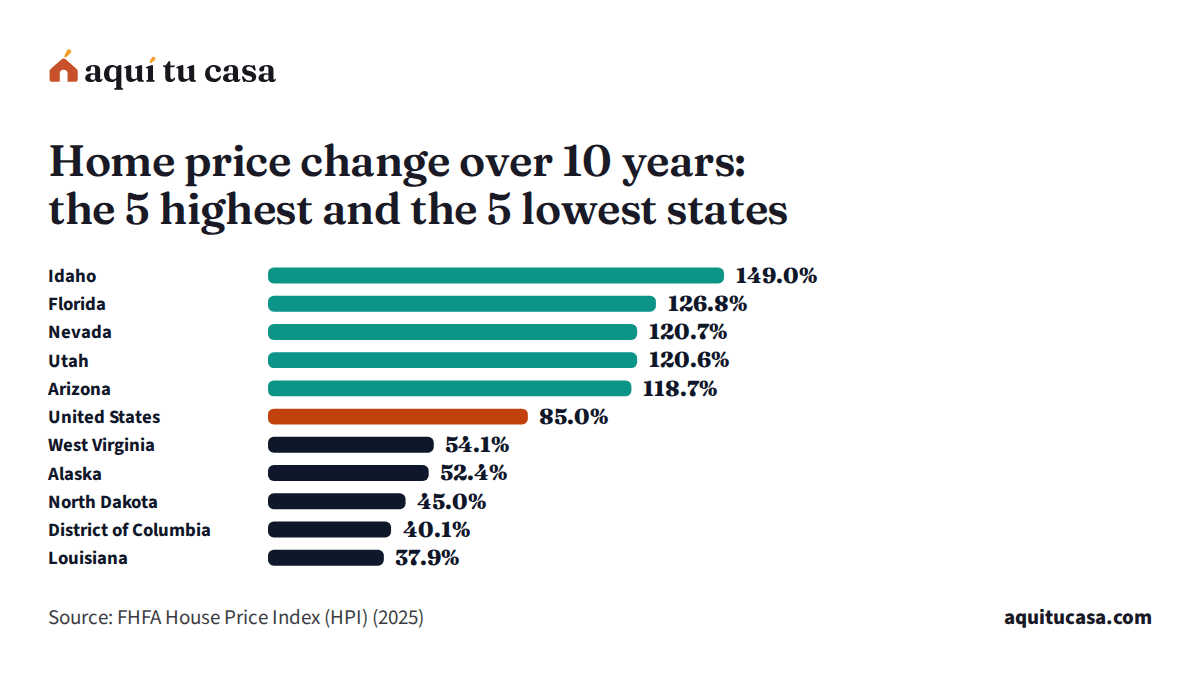
In the United States, the figure is 85.0%, according to FHFA (2025 data). By state it runs from 37.9% in Louisiana to 149.0% in Idaho, and the median state is at 85.6%.
Your county
And in your county?
Type your county and see its figure next to your state's and the U.S.
The key figures
- United States
- 85.0%
- 2025 data
- Highest: Idaho
- 149.0%
- 75% above the U.S.
- Lowest: Louisiana
- 37.9%
- 55% below the U.S.
FHFA House Price Index · 2025 data Source: FHFA House Price Index (HPI) Data from 2025 data FHFA House Price Index (HPI) (external site)
By state
How it spreads across the states
Each bar is a state, from the highest figure to the lowest. The line marks the U.S. figure. Tap a state in the table to see its counties.
The 5 highest
The 5 lowest
- 1 Louisiana 37.9% −55%
- 2 District of Columbia 40.1% −53%
- 3 North Dakota 45.0% −47%
- 4 Alaska 52.4% −38%
- 5 West Virginia 54.1% −36%
It compares housing costs, not quality of life.
See the full rankingData
Home price change by state
The lowest is Louisiana (37.9%) and the highest, Idaho (149.0%).
- 37.9%–65.4%
- 67.5%–78.6%
- 80.3%–87.7%
- 88.2%–106.6%
- 110.1%–149.0%
- 1 state without data
All states
Tap a state’s name to see its counties. Sort by any column.
| Alabama | 77.2% | 2.5% |
|---|---|---|
| Alaska | 52.4% | 4.1% |
| Arizona | 118.7% | 0.9% |
| Arkansas | 78.6% | 3.4% |
| California | 80.3% | 0.8% |
| Colorado | 93.3% | 0.1% |
| Connecticut | 75.1% | 6.1% |
| Delaware | 74.2% | 3.2% |
| District of Columbia | 40.1% | 0.4% |
| Florida | 126.8% | -0.5% |
| Georgia | 110.1% | 2.2% |
| Hawaii | 73.3% | 2.9% |
| Idaho | 149.0% | 2.3% |
| Illinois | 64.6% | 5.7% |
| Indiana | 94.5% | 4.3% |
| Iowa | 65.4% | 3.2% |
| Kansas | 83.6% | 4.1% |
| Kentucky | 84.1% | 3.9% |
| Louisiana | 37.9% | 1.8% |
| Maine | 112.4% | 4.7% |
| Maryland | 59.8% | 2.7% |
| Massachusetts | 87.1% | 3.7% |
| Michigan | 96.7% | 4.7% |
| Minnesota | 71.4% | 2.8% |
| Mississippi | 62.3% | 3.5% |
| Missouri | 88.2% | 3.7% |
| Montana | 105.0% | 2.3% |
| Nebraska | 87.0% | 3.3% |
| Nevada | 120.7% | 2.2% |
| New Hampshire | 113.0% | 4.7% |
| New Jersey | 87.7% | 6.2% |
| New Mexico | 81.6% | 3.1% |
| New York | 85.6% | 6.0% |
| North Carolina | 106.6% | 2.5% |
| North Dakota | 45.0% | 5.1% |
| Ohio | 93.4% | 4.8% |
| Oklahoma | 71.1% | 2.6% |
| Oregon | 85.5% | 0.9% |
| Pennsylvania | 76.8% | 4.7% |
| Puerto Rico | Not available | Not available |
| Rhode Island | 112.1% | 5.4% |
| South Carolina | 104.3% | 3.6% |
| South Dakota | 84.7% | 3.1% |
| Tennessee | 113.5% | 2.4% |
| Texas | 88.2% | 0.8% |
| Utah | 120.6% | 2.4% |
| Vermont | 88.8% | 3.6% |
| Virginia | 74.6% | 3.7% |
| Washington | 113.0% | 1.8% |
| West Virginia | 54.1% | 4.1% |
| Wisconsin | 95.5% | 5.4% |
| Wyoming | 67.5% | 4.1% |
- Alabama 77.2%2.5%
- Alaska 52.4%4.1%
- Arizona 118.7%0.9%
- Arkansas 78.6%3.4%
- California 80.3%0.8%
- Colorado 93.3%0.1%
- Connecticut 75.1%6.1%
- Delaware 74.2%3.2%
- District of Columbia 40.1%0.4%
- Florida 126.8%-0.5%
- Georgia 110.1%2.2%
- Hawaii 73.3%2.9%
- Idaho 149.0%2.3%
- Illinois 64.6%5.7%
- Indiana 94.5%4.3%
- Iowa 65.4%3.2%
- Kansas 83.6%4.1%
- Kentucky 84.1%3.9%
- Louisiana 37.9%1.8%
- Maine 112.4%4.7%
- Maryland 59.8%2.7%
- Massachusetts 87.1%3.7%
- Michigan 96.7%4.7%
- Minnesota 71.4%2.8%
- Mississippi 62.3%3.5%
- Missouri 88.2%3.7%
- Montana 105.0%2.3%
- Nebraska 87.0%3.3%
- Nevada 120.7%2.2%
- New Hampshire 113.0%4.7%
- New Jersey 87.7%6.2%
- New Mexico 81.6%3.1%
- New York 85.6%6.0%
- North Carolina 106.6%2.5%
- North Dakota 45.0%5.1%
- Ohio 93.4%4.8%
- Oklahoma 71.1%2.6%
- Oregon 85.5%0.9%
- Pennsylvania 76.8%4.7%
- Puerto Rico Not availableNot available
- Rhode Island 112.1%5.4%
- South Carolina 104.3%3.6%
- South Dakota 84.7%3.1%
- Tennessee 113.5%2.4%
- Texas 88.2%0.8%
- Utah 120.6%2.4%
- Vermont 88.8%3.6%
- Virginia 74.6%3.7%
- Washington 113.0%1.8%
- West Virginia 54.1%4.1%
- Wisconsin 95.5%5.4%
- Wyoming 67.5%4.1%
Text file (UTF-8) with one row per state, the source and its date. Opens in Excel, Google Sheets or Numbers.
FHFA House Price Index · 2025 data Source: FHFA House Price Index (HPI) Data from 2025 data FHFA House Price Index (HPI) (external site)
Official source
Methodology: where this number comes from
The source, the data date, how we compute it and what to know before you use it.
About this measure
- Source
- FHFA House Price Index (HPI)
- Published by
- FHFA
- Type
- Our calculation from the source
- Data date
- 2025 data
- Geography
- 51 states (with the District of Columbia) and 2,795 of 3,222 counties: FHFA publishes no index where there are too few sales
- Unit
- Percentage
- License
- Public domain (U.S. government data)
How we calculate it
Formula
Index in 2025 ÷ index 10 years earlier − 1
The 2025 change is the one FHFA publishes. We compute the 10-year change from FHFA’s annual index: we divide the 2025 value by the value 10 years earlier and subtract 1, only when FHFA publishes both years. Counties show their own change on their page.
Before you use this number
FHFA considers its annual state and county indexes experimental; they can change when FHFA receives more data.
The index only includes homes with loans bought or guaranteed by Fannie Mae or Freddie Mac; it does not count every sale.
A past change does not tell you how prices will change in the future.
FHFA House Price Index (HPI)
FHFA
- Current version
- 2025 data
- Released
- March 31, 2026
- Retrieved by us
- November 6, 2026
- License
- Public domain (U.S. government data)
Guides that explain this number
-
Buying a home
How to buy a home in the United States, step by step
The nine steps to buying a home: paperwork, credit, budget, assistance, preapproval, offer, inspection, closing and the first year, with official sources.
-
Buying a home
What if the appraisal comes in low, and what you can do
Why a low appraisal matters, your right to a copy, how to negotiate, pay the difference or cancel, and how to ask for a reconsideration of value.
-
Buying a home
How much do you need for a down payment?
20% is not required: what each loan asks for (FHA, conventional, VA, USDA), what changes with less than 20% down, and where the money can come from.
Other data in this group
The other measures in this group, with the U.S. figure.
-
Typical home value
$332,700The median value of owner-occupied homes, from the Census Bureau.
-
Typical rent
$1,413The median gross rent (rent plus basic utilities) of renter households, from the Census Bureau.
-
What HUD estimates a modest 2-bedroom apartment costs in each area, utilities included.
-
What a full-time worker needs to earn per hour so the 2-bedroom Fair Market Rent stays within 30% of income.
-
The share of renter households spending 30% or more of their income on rent; also those spending 50% or more.
Find it in your county
Every county and municipality has its page with this number, the other indicators and free help near you.
Your saved place