Data · U.S. Census Bureau
Typical home value
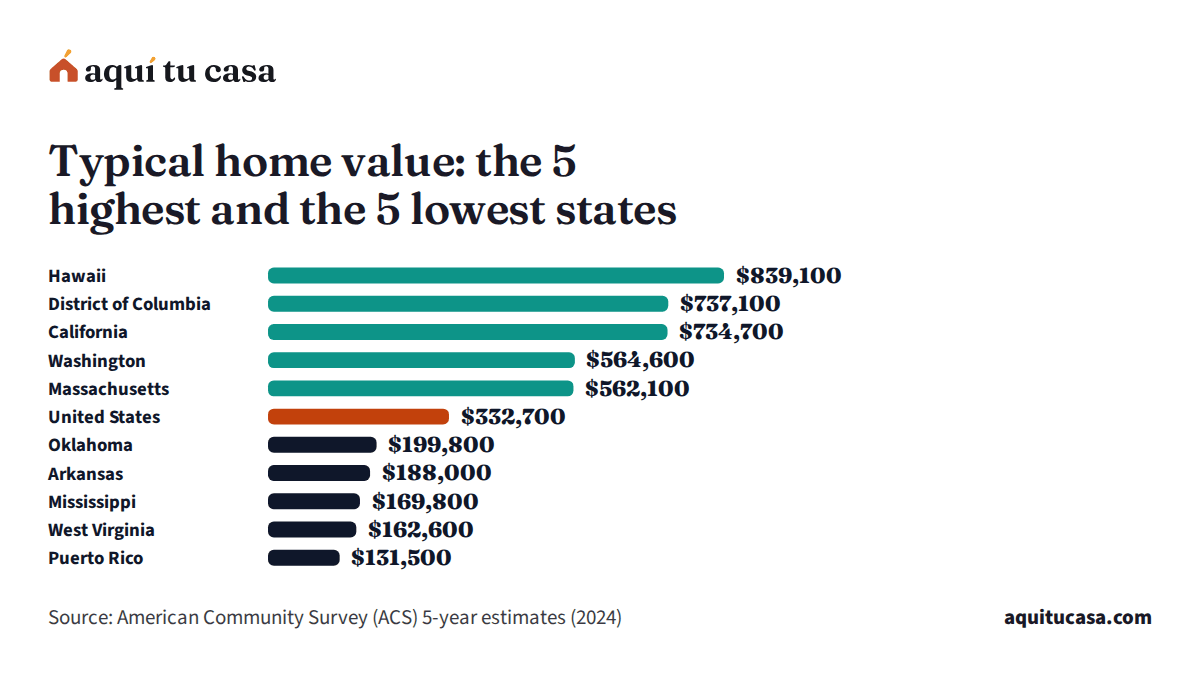
In the United States, the figure is $332,700, according to U.S. Census Bureau (Average 2020–2024). By state it runs from $131,500 in Puerto Rico to $839,100 in Hawaii, and the median state is at $303,300.
Your county
And in your county?
Type your county and see its figure next to your state's and the U.S.
The key figures
- United States
- $332,700
- Average 2020–2024
- Highest: Hawaii
- $839,100
- 152% above the U.S.
- Lowest: Puerto Rico
- $131,500
- 60% below the U.S.
American Community Survey · Average 2020–2024 Source: American Community Survey (ACS) 5-year estimates Average 2020–2024 American Community Survey (ACS) 5-year estimates (external site)
By state
How it spreads across the states
Each bar is a state, from the highest figure to the lowest. The line marks the U.S. figure. Tap a state in the table to see its counties.
The 5 highest
- 1 Hawaii $839,100 +152%
- 2 District of Columbia $737,100 +122%
- 3 California $734,700 +121%
- 4 Washington $564,600 +70%
- 5 Massachusetts $562,100 +69%
The 5 lowest
- 1 Puerto Rico $131,500 −60%
- 2 West Virginia $162,600 −51%
- 3 Mississippi $169,800 −49%
- 4 Arkansas $188,000 −43%
- 5 Oklahoma $199,800 −40%
It compares housing costs, not quality of life.
See the full rankingData
Typical home value by state
The lowest is Puerto Rico ($131,500) and the highest, Hawaii ($839,100).
- $131,500–$216,500
- $217,200–$259,000
- $263,300–$352,000
- $352,900–$419,900
- $423,800–$839,100
All states
Tap a state’s name to see its counties. Sort by any column.
| Alabama | $209,900 |
|---|---|
| Alaska | $352,900 |
| Arizona | $394,500 |
| Arkansas | $188,000 |
| California | $734,700 |
| Colorado | $539,400 |
| Connecticut | $366,900 |
| Delaware | $352,000 |
| District of Columbia | $737,100 |
| Florida | $359,000 |
| Georgia | $303,300 |
| Hawaii | $839,100 |
| Idaho | $418,600 |
| Illinois | $263,300 |
| Indiana | $218,200 |
| Iowa | $208,000 |
| Kansas | $217,200 |
| Kentucky | $205,600 |
| Louisiana | $216,500 |
| Maine | $296,600 |
| Maryland | $419,900 |
| Massachusetts | $562,100 |
| Michigan | $231,600 |
| Minnesota | $329,300 |
| Mississippi | $169,800 |
| Missouri | $230,300 |
| Montana | $375,800 |
| Nebraska | $238,600 |
| Nevada | $435,400 |
| New Hampshire | $402,500 |
| New Jersey | $454,400 |
| New Mexico | $248,100 |
| New York | $423,800 |
| North Carolina | $288,900 |
| North Dakota | $249,900 |
| Ohio | $214,800 |
| Oklahoma | $199,800 |
| Oregon | $477,600 |
| Pennsylvania | $254,500 |
| Puerto Rico | $131,500 |
| Rhode Island | $404,200 |
| South Carolina | $259,000 |
| South Dakota | $257,400 |
| Tennessee | $286,700 |
| Texas | $283,800 |
| Utah | $489,400 |
| Vermont | $316,600 |
| Virginia | $383,700 |
| Washington | $564,600 |
| West Virginia | $162,600 |
| Wisconsin | $266,500 |
| Wyoming | $309,700 |
- Alabama $209,900
- Alaska $352,900
- Arizona $394,500
- Arkansas $188,000
- California $734,700
- Colorado $539,400
- Connecticut $366,900
- Delaware $352,000
- District of Columbia $737,100
- Florida $359,000
- Georgia $303,300
- Hawaii $839,100
- Idaho $418,600
- Illinois $263,300
- Indiana $218,200
- Iowa $208,000
- Kansas $217,200
- Kentucky $205,600
- Louisiana $216,500
- Maine $296,600
- Maryland $419,900
- Massachusetts $562,100
- Michigan $231,600
- Minnesota $329,300
- Mississippi $169,800
- Missouri $230,300
- Montana $375,800
- Nebraska $238,600
- Nevada $435,400
- New Hampshire $402,500
- New Jersey $454,400
- New Mexico $248,100
- New York $423,800
- North Carolina $288,900
- North Dakota $249,900
- Ohio $214,800
- Oklahoma $199,800
- Oregon $477,600
- Pennsylvania $254,500
- Puerto Rico $131,500
- Rhode Island $404,200
- South Carolina $259,000
- South Dakota $257,400
- Tennessee $286,700
- Texas $283,800
- Utah $489,400
- Vermont $316,600
- Virginia $383,700
- Washington $564,600
- West Virginia $162,600
- Wisconsin $266,500
- Wyoming $309,700
Text file (UTF-8) with one row per state, the source and its date. Opens in Excel, Google Sheets or Numbers.
American Community Survey · Average 2020–2024 Source: American Community Survey (ACS) 5-year estimates Average 2020–2024 American Community Survey (ACS) 5-year estimates (external site)
Official source
Methodology: where this number comes from
The source, the data date, how we compute it and what to know before you use it.
About this measure
- Published by
- U.S. Census Bureau
- Type
- Source figure, unchanged
- Data date
- Average 2020–2024
- Geography
- United States: 50 states (plus District of Columbia and Puerto Rico) and 3,222 counties and municipalities
- Unit
- Dollars
- Updated
- Every year, normally in December (five-year estimates)
- License
- Public domain (U.S. government data)
Before you use this number
It is what owners believe their home is worth, not a sale price. It usually sits below the prices of homes selling today.
It averages five years of survey, not this month’s prices. Use it to compare places, not to appraise a home.
In small counties the margin of error is large; we mark those numbers as approximate or leave them out.
American Community Survey (ACS) 5-year estimates
U.S. Census Bureau
- Current version
- Average 2020–2024
- Released
- January 29, 2026
- Retrieved by us
- November 6, 2026
- Next update
- Every year, normally in December (five-year estimates)
- License
- Public domain (U.S. government data)
Guides that explain this number
-
Buying a home
How much do you need for a down payment?
20% is not required: what each loan asks for (FHA, conventional, VA, USDA), what changes with less than 20% down, and where the money can come from.
-
Buying a home
How to buy a home in the United States, step by step
The nine steps to buying a home: paperwork, credit, budget, assistance, preapproval, offer, inspection, closing and the first year, with official sources.
-
Buying a home
Preapproval vs. prequalification: what each letter means
What prequalification and preapproval letters are, what lenders check, why neither one is a loan, and how to compare lenders without hurting your credit.
Other data in this group
The other measures in this group, with the U.S. figure.
-
Typical rent
$1,413The median gross rent (rent plus basic utilities) of renter households, from the Census Bureau.
-
Home price change
85.0%How much the price of the same homes changed according to the FHFA index: over 10 years and in 2025.
-
What HUD estimates a modest 2-bedroom apartment costs in each area, utilities included.
-
What a full-time worker needs to earn per hour so the 2-bedroom Fair Market Rent stays within 30% of income.
-
The share of renter households spending 30% or more of their income on rent; also those spending 50% or more.
Find it in your county
Every county and municipality has its page with this number, the other indicators and free help near you.
Your saved place