Data · HUD
Hourly wage to rent a 2-bedroom
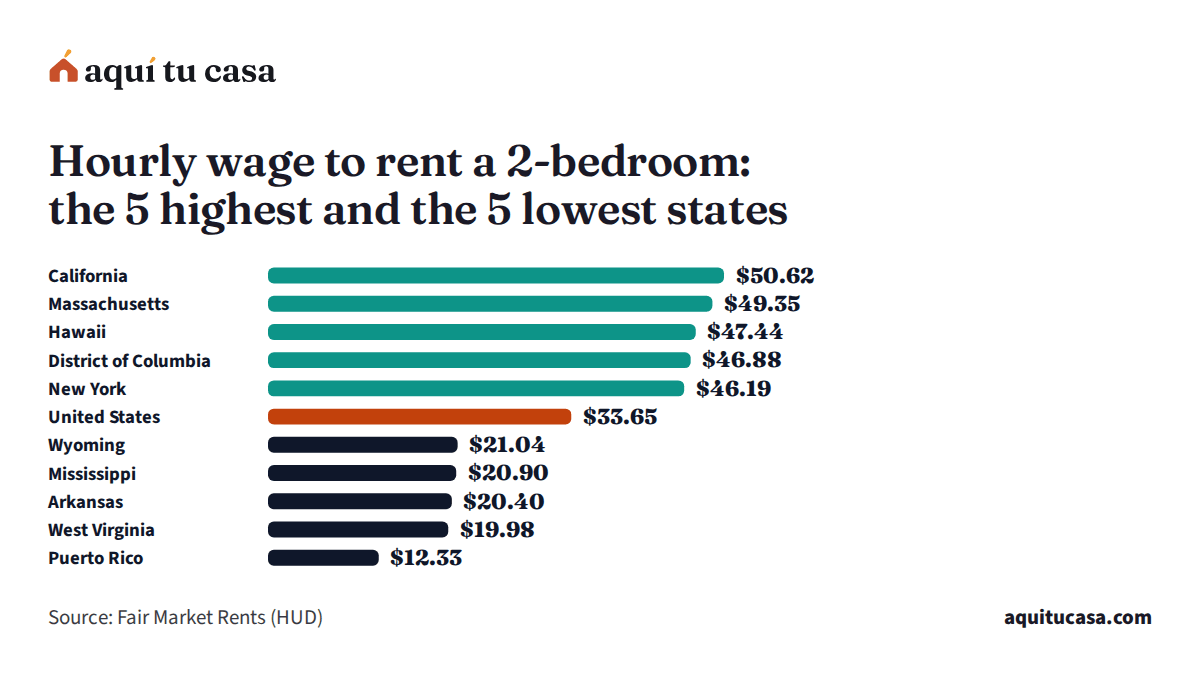
In the United States, the figure is $33.65, according to HUD (Fiscal year 2027). By state it runs from $12.33 in Puerto Rico to $50.62 in California, and the median state is at $28.98.
Your county
And in your county?
Type your county and see its figure next to your state's and the U.S.
The key figures
- United States
- $33.65
- per hour · Fiscal year 2027
- Highest: California
- $50.62
- 50% above the U.S.
- Lowest: Puerto Rico
- $12.33
- 63% below the U.S.
Fair Market Rents · Fiscal year 2027 Source: Fair Market Rents (HUD) Fiscal year 2027 Fair Market Rents (HUD) (external site)
By state
How it spreads across the states
Each bar is a state, from the highest figure to the lowest. The line marks the U.S. figure. Tap a state in the table to see its counties.
The 5 highest
- 1 California $50.62 +50%
- 2 Massachusetts $49.35 +47%
- 3 Hawaii $47.44 +41%
- 4 District of Columbia $46.88 +39%
- 5 New York $46.19 +37%
The 5 lowest
- 1 Puerto Rico $12.33 −63%
- 2 West Virginia $19.98 −41%
- 3 Arkansas $20.40 −39%
- 4 Mississippi $20.90 −38%
- 5 Wyoming $21.04 −37%
It compares housing costs, not quality of life.
See the full rankingData
Hourly wage to rent a 2-bedroom by state
The lowest is Puerto Rico ($12.33) and the highest, California ($50.62).
- $12.33–$22.33
- $22.50–$26.17
- $26.29–$29.40
- $31.08–$36.85
- $37.73–$50.62
All states
Tap a state’s name to see its counties. Sort by any column.
| Alabama | $22.50 | $1,170 |
|---|---|---|
| Alaska | $29.21 | $1,519 |
| Arizona | $31.08 | $1,616 |
| Arkansas | $20.40 | $1,061 |
| California | $50.62 | $2,632 |
| Colorado | $36.85 | $1,916 |
| Connecticut | $39.10 | $2,033 |
| Delaware | $33.21 | $1,727 |
| District of Columbia | $46.88 | $2,438 |
| Florida | $37.73 | $1,962 |
| Georgia | $29.38 | $1,528 |
| Hawaii | $47.44 | $2,467 |
| Idaho | $26.29 | $1,367 |
| Illinois | $33.15 | $1,724 |
| Indiana | $25.04 | $1,302 |
| Iowa | $21.40 | $1,113 |
| Kansas | $23.31 | $1,212 |
| Kentucky | $22.21 | $1,155 |
| Louisiana | $22.33 | $1,161 |
| Maine | $32.96 | $1,714 |
| Maryland | $40.44 | $2,103 |
| Massachusetts | $49.35 | $2,566 |
| Michigan | $26.17 | $1,361 |
| Minnesota | $28.98 | $1,507 |
| Mississippi | $20.90 | $1,087 |
| Missouri | $24.04 | $1,250 |
| Montana | $29.40 | $1,529 |
| Nebraska | $24.23 | $1,260 |
| Nevada | $32.15 | $1,672 |
| New Hampshire | $38.65 | $2,010 |
| New Jersey | $43.62 | $2,268 |
| New Mexico | $24.65 | $1,282 |
| New York | $46.19 | $2,402 |
| North Carolina | $27.71 | $1,441 |
| North Dakota | $21.19 | $1,102 |
| Ohio | $24.48 | $1,273 |
| Oklahoma | $21.67 | $1,127 |
| Oregon | $32.52 | $1,691 |
| Pennsylvania | $29.38 | $1,528 |
| Puerto Rico | $12.33 | $641 |
| Rhode Island | $36.75 | $1,911 |
| South Carolina | $26.75 | $1,391 |
| South Dakota | $22.83 | $1,187 |
| Tennessee | $26.56 | $1,381 |
| Texas | $28.62 | $1,488 |
| Utah | $28.71 | $1,493 |
| Vermont | $34.10 | $1,773 |
| Virginia | $34.46 | $1,792 |
| Washington | $39.31 | $2,044 |
| West Virginia | $19.98 | $1,039 |
| Wisconsin | $24.06 | $1,251 |
| Wyoming | $21.04 | $1,094 |
- Alabama $22.50$1,170
- Alaska $29.21$1,519
- Arizona $31.08$1,616
- Arkansas $20.40$1,061
- California $50.62$2,632
- Colorado $36.85$1,916
- Connecticut $39.10$2,033
- Delaware $33.21$1,727
- District of Columbia $46.88$2,438
- Florida $37.73$1,962
- Georgia $29.38$1,528
- Hawaii $47.44$2,467
- Idaho $26.29$1,367
- Illinois $33.15$1,724
- Indiana $25.04$1,302
- Iowa $21.40$1,113
- Kansas $23.31$1,212
- Kentucky $22.21$1,155
- Louisiana $22.33$1,161
- Maine $32.96$1,714
- Maryland $40.44$2,103
- Massachusetts $49.35$2,566
- Michigan $26.17$1,361
- Minnesota $28.98$1,507
- Mississippi $20.90$1,087
- Missouri $24.04$1,250
- Montana $29.40$1,529
- Nebraska $24.23$1,260
- Nevada $32.15$1,672
- New Hampshire $38.65$2,010
- New Jersey $43.62$2,268
- New Mexico $24.65$1,282
- New York $46.19$2,402
- North Carolina $27.71$1,441
- North Dakota $21.19$1,102
- Ohio $24.48$1,273
- Oklahoma $21.67$1,127
- Oregon $32.52$1,691
- Pennsylvania $29.38$1,528
- Puerto Rico $12.33$641
- Rhode Island $36.75$1,911
- South Carolina $26.75$1,391
- South Dakota $22.83$1,187
- Tennessee $26.56$1,381
- Texas $28.62$1,488
- Utah $28.71$1,493
- Vermont $34.10$1,773
- Virginia $34.46$1,792
- Washington $39.31$2,044
- West Virginia $19.98$1,039
- Wisconsin $24.06$1,251
- Wyoming $21.04$1,094
Text file (UTF-8) with one row per state, the source and its date. Opens in Excel, Google Sheets or Numbers.
Fair Market Rents · Fiscal year 2027 Source: Fair Market Rents (HUD) Fiscal year 2027 Fair Market Rents (HUD) (external site)
Official source
Methodology: where this number comes from
The source, the data date, how we compute it and what to know before you use it.
About this measure
- Source
- Fair Market Rents (HUD)
- Published by
- HUD
- Type
- Our calculation from the source
- Data date
- Fiscal year 2027
- Geography
- United States: 50 states (plus District of Columbia and Puerto Rico) and 3,222 counties and municipalities
- Unit
- Dollars per hour
- Updated
- Every fiscal year (in effect October 1)
- License
- Public domain (U.S. government data)
How we calculate it
Formula
2-bedroom Fair Market Rent × 12 months ÷ 30% ÷ 2,080 hours per year
We take HUD’s two-bedroom Fair Market Rent, multiply it by twelve months and divide it by 30% (the share of income rent should not exceed) and by 2,080 hours of work per year (40 hours a week, every week). The result is the hourly income needed. It resembles the “housing wage” the National Low Income Housing Coalition publishes, but it is our calculation with HUD’s data; it is not a rule of any program.
What the state figure shows
The state figure comes from its Fair Market Rent (the average of its counties weighted by population). Your county’s wage is on its page.
Before you use this number
It assumes one full-time income. With two incomes or more hours, the wage each person needs is lower.
30% is a reference, not a rule: many households pay more, and many programs use other limits.
It inherits the limits of the Fair Market Rent: an administrative reference by area, not the price of each home.
Fair Market Rents (HUD)
HUD
- Current version
- Fiscal year 2027
- In effect since
- October 1, 2026
- Retrieved by us
- November 6, 2026
- Next update
- Every fiscal year (in effect October 1)
- License
- Public domain (U.S. government data)
Guides that explain this number
-
Taxes and money
A family budget with several incomes: how to build it
How to budget when several incomes, cash and remittances come into the home: tracking, weekly cash flow, rent and the emergency fund.
-
Renting
How to rent without a Social Security number or credit
What a landlord can ask for, what to offer instead of an SSN and credit, how much rent fits your income and your rights if you are turned down.
-
Renting
Section 8 and mixed-status families: how it works
How the Section 8 voucher works, how aid is prorated in a mixed-status family, how to apply through your housing agency and what HUD proposed.
Other data in this group
The other measures in this group, with the U.S. figure.
-
Typical home value
$332,700The median value of owner-occupied homes, from the Census Bureau.
-
Typical rent
$1,413The median gross rent (rent plus basic utilities) of renter households, from the Census Bureau.
-
Home price change
85.0%How much the price of the same homes changed according to the FHFA index: over 10 years and in 2025.
-
What HUD estimates a modest 2-bedroom apartment costs in each area, utilities included.
-
The share of renter households spending 30% or more of their income on rent; also those spending 50% or more.
Find it in your county
Every county and municipality has its page with this number, the other indicators and free help near you.
Your saved place