Data · U.S. Census Bureau
Effective property tax rate
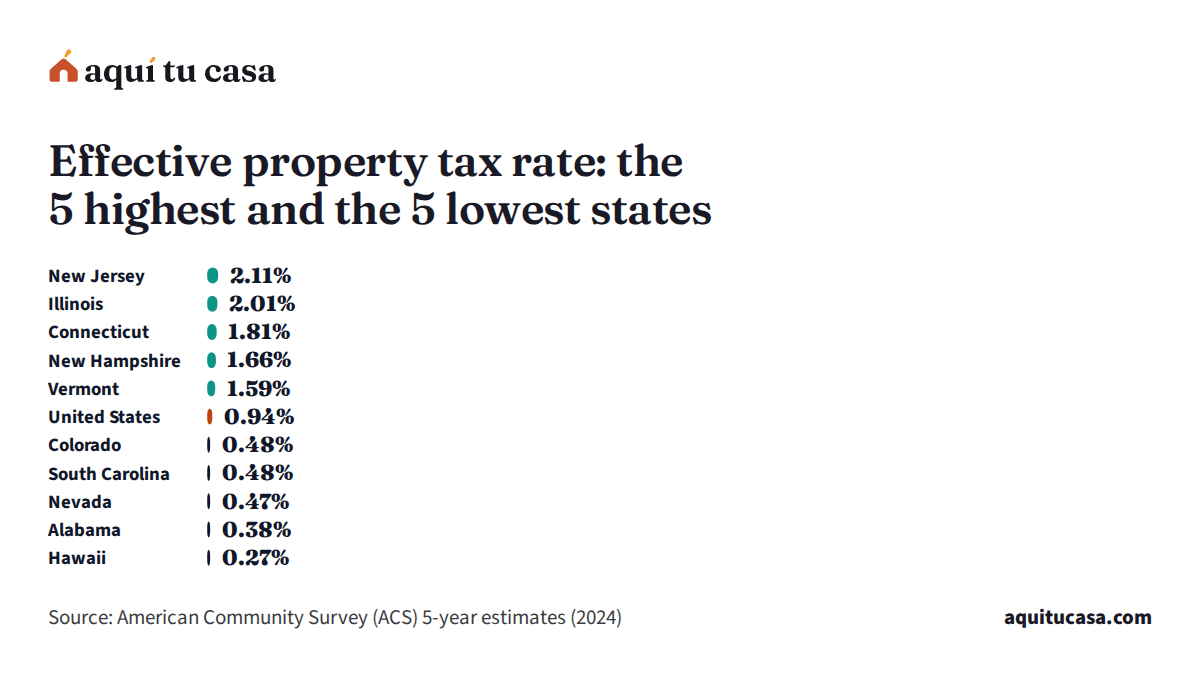
In the United States, the figure is 0.94%, according to U.S. Census Bureau (Average 2020–2024). By state it runs from 0.27% in Hawaii to 2.11% in New Jersey, and the median state is at 0.80%.
Your county
And in your county?
Type your county and see its figure next to your state's and the U.S.
The key figures
- United States
- 0.94%
- Average 2020–2024
- Highest: New Jersey
- 2.11%
- 124% above the U.S.
- Lowest: Hawaii
- 0.27%
- 71% below the U.S.
American Community Survey · Average 2020–2024 Source: American Community Survey (ACS) 5-year estimates Average 2020–2024 American Community Survey (ACS) 5-year estimates (external site)
By state
How it spreads across the states
Each bar is a state, from the highest figure to the lowest. The line marks the U.S. figure. Tap a state in the table to see its counties.
The 5 highest
- 1 New Jersey 2.11% +124%
- 2 Illinois 2.01% +114%
- 3 Connecticut 1.81% +93%
- 4 New Hampshire 1.66% +77%
- 5 Vermont 1.59% +69%
The 5 lowest
- 1 Hawaii 0.27% −71%
- 2 Alabama 0.38% −60%
- 3 Nevada 0.47% −50%
- 4 South Carolina 0.48% −49%
- 5 Colorado 0.48% −49%
It compares housing costs, not quality of life.
See the full rankingData
Effective property tax rate by state
The lowest is Hawaii (0.27%) and the highest, New Jersey (2.11%).
- 0.27%–0.53%
- 0.55%–0.74%
- 0.75%–1.02%
- 1.06%–1.31%
- 1.39%–2.11%
All states
Tap a state’s name to see its counties. Sort by any column.
| Alabama | 0.38% | $788 |
|---|---|---|
| Alaska | 1.11% | $3,901 |
| Arizona | 0.48% | $1,879 |
| Arkansas | 0.55% | $1,040 |
| California | 0.70% | $5,124 |
| Colorado | 0.48% | $2,602 |
| Connecticut | 1.81% | $6,643 |
| Delaware | 0.50% | $1,768 |
| District of Columbia | 0.58% | $4,312 |
| Florida | 0.76% | $2,730 |
| Georgia | 0.77% | $2,341 |
| Hawaii | 0.27% | $2,239 |
| Idaho | 0.49% | $2,038 |
| Illinois | 2.01% | $5,298 |
| Indiana | 0.74% | $1,614 |
| Iowa | 1.39% | $2,897 |
| Kansas | 1.29% | $2,798 |
| Kentucky | 0.75% | $1,544 |
| Louisiana | 0.55% | $1,180 |
| Maine | 1.02% | $3,036 |
| Maryland | 0.97% | $4,093 |
| Massachusetts | 1.07% | $5,992 |
| Michigan | 1.25% | $2,904 |
| Minnesota | 1.02% | $3,357 |
| Mississippi | 0.72% | $1,215 |
| Missouri | 0.85% | $1,948 |
| Montana | 0.72% | $2,693 |
| Nebraska | 1.49% | $3,549 |
| Nevada | 0.47% | $2,027 |
| New Hampshire | 1.66% | $6,667 |
| New Jersey | 2.11% | $9,590 |
| New Mexico | 0.70% | $1,731 |
| New York | 1.55% | $6,582 |
| North Carolina | 0.66% | $1,896 |
| North Dakota | 0.99% | $2,468 |
| Ohio | 1.31% | $2,822 |
| Oklahoma | 0.80% | $1,599 |
| Oregon | 0.81% | $3,876 |
| Pennsylvania | 1.30% | $3,311 |
| Puerto Rico | 0.49% | $646 |
| Rhode Island | 1.21% | $4,900 |
| South Carolina | 0.48% | $1,251 |
| South Dakota | 1.06% | $2,724 |
| Tennessee | 0.50% | $1,442 |
| Texas | 1.49% | $4,232 |
| Utah | 0.52% | $2,525 |
| Vermont | 1.59% | $5,039 |
| Virginia | 0.73% | $2,790 |
| Washington | 0.81% | $4,556 |
| West Virginia | 0.53% | $865 |
| Wisconsin | 1.42% | $3,792 |
| Wyoming | 0.57% | $1,767 |
- Alabama 0.38%$788
- Alaska 1.11%$3,901
- Arizona 0.48%$1,879
- Arkansas 0.55%$1,040
- California 0.70%$5,124
- Colorado 0.48%$2,602
- Connecticut 1.81%$6,643
- Delaware 0.50%$1,768
- District of Columbia 0.58%$4,312
- Florida 0.76%$2,730
- Georgia 0.77%$2,341
- Hawaii 0.27%$2,239
- Idaho 0.49%$2,038
- Illinois 2.01%$5,298
- Indiana 0.74%$1,614
- Iowa 1.39%$2,897
- Kansas 1.29%$2,798
- Kentucky 0.75%$1,544
- Louisiana 0.55%$1,180
- Maine 1.02%$3,036
- Maryland 0.97%$4,093
- Massachusetts 1.07%$5,992
- Michigan 1.25%$2,904
- Minnesota 1.02%$3,357
- Mississippi 0.72%$1,215
- Missouri 0.85%$1,948
- Montana 0.72%$2,693
- Nebraska 1.49%$3,549
- Nevada 0.47%$2,027
- New Hampshire 1.66%$6,667
- New Jersey 2.11%$9,590
- New Mexico 0.70%$1,731
- New York 1.55%$6,582
- North Carolina 0.66%$1,896
- North Dakota 0.99%$2,468
- Ohio 1.31%$2,822
- Oklahoma 0.80%$1,599
- Oregon 0.81%$3,876
- Pennsylvania 1.30%$3,311
- Puerto Rico 0.49%$646
- Rhode Island 1.21%$4,900
- South Carolina 0.48%$1,251
- South Dakota 1.06%$2,724
- Tennessee 0.50%$1,442
- Texas 1.49%$4,232
- Utah 0.52%$2,525
- Vermont 1.59%$5,039
- Virginia 0.73%$2,790
- Washington 0.81%$4,556
- West Virginia 0.53%$865
- Wisconsin 1.42%$3,792
- Wyoming 0.57%$1,767
Text file (UTF-8) with one row per state, the source and its date. Opens in Excel, Google Sheets or Numbers.
American Community Survey · Average 2020–2024 Source: American Community Survey (ACS) 5-year estimates Average 2020–2024 American Community Survey (ACS) 5-year estimates (external site)
Official source
Methodology: where this number comes from
The source, the data date, how we compute it and what to know before you use it.
About this measure
- Published by
- U.S. Census Bureau
- Type
- Our calculation from the source
- Data date
- Average 2020–2024
- Geography
- United States: 50 states (plus District of Columbia and Puerto Rico) and 3,222 counties and municipalities
- Unit
- Percentage
- Updated
- Every year, normally in December (five-year estimates)
- License
- Public domain (U.S. government data)
How we calculate it
Formula
Typical tax per year ÷ typical home value
We divide the median real estate tax owners pay per year by the median value of their homes, both from the same Census period. The result is an approximate “effective” rate: what owners actually pay, exemptions included, not the nominal rate each local government sets. The calculators use it to estimate the tax inside the monthly payment.
Before you use this number
It divides two medians from different households, not the rate of one home. The real rate varies by city, school district and exemptions (such as homestead).
The tax you will pay can differ: many places reassess a home when it changes hands.
In small counties the margin of error is large; we mark those numbers as approximate or leave them out.
American Community Survey (ACS) 5-year estimates
U.S. Census Bureau
- Current version
- Average 2020–2024
- Released
- January 29, 2026
- Retrieved by us
- November 6, 2026
- Next update
- Every year, normally in December (five-year estimates)
- License
- Public domain (U.S. government data)
Guides that explain this number
-
Owning a home
Property tax explained: how it is calculated and paid
Who charges property tax, how it is calculated, how it is paid through escrow, which exemptions and appeals exist and what part is deductible.
-
Owning a home
Homestead exemption: what it is, what it saves, how to apply
What the homestead exemption is, who qualifies, how much it lowers your home's value in Texas, Florida and California, how to apply and which dates matter.
-
Owning a home
How to appeal your property tax assessment, step by step
How to read your notice of value, what evidence works, how the informal review and hearing work, and protest deadlines in Texas, Florida and California.
Other data in this group
The other measures in this group, with the U.S. figure.
-
Typical household income
$80,734The median annual income of households, from the Census Bureau.
Find it in your county
Every county and municipality has its page with this number, the other indicators and free help near you.
Your saved place