Map · HUD
FHA loan limit (1 unit) on the map
The limit for a one-unit home runs from $541,287, the national floor, to $1,299,500, the ceiling, according to HUD (2026 data). In 44 states the county median is $541,287, the lowest figure; the highest is New Jersey's ($1,249,125).
Your county
And in your county?
Type your county and see its figure next to your state's and the U.S.
The key figures
- National minimum (“floor”)
- $541,287
- 44 states with the median at the lowest figure
- National maximum (“ceiling”)
- $1,299,500
- The highest cap the source sets.
- Highest: District of Columbia
- $1,249,125
FHA mortgage limits · 2026 data Source: FHA mortgage limits (HUD) Data from 2026 data FHA mortgage limits (HUD) (external site)
Every state on the map
FHA loan limit (1 unit) in every state and in 3,222 counties across 52 states, on one color scale so you can compare places at a glance. Tap a state to see its counties one by one.
In short
What the map shows
44 states have their middle county at the national floor of $541,287; in the other 8, the middle county is above the floor.
If you order the 52 states from highest to lowest, the middle value is $541,287, shared by 44 states.
The highest, 2 tied states ($1,249,125), is 2.3 times the lowest, 44 tied states ($541,287).
By Census region
The middle state of each region, and the highest and lowest of each.
| Region | Middle state | Highest | Lowest |
|---|---|---|---|
| NortheastStates: 9 | $541,287 | New Jersey $1,249,125 | Vermont $541,287 |
| MidwestStates: 12 | $541,287 | Illinois $541,287 | Wisconsin $541,287 |
| SouthStates: 17 | $541,287 | District of Columbia $1,249,125 | West Virginia $541,287 |
| WestStates: 13 | $541,287 | Hawaii $1,110,900 | Wyoming $541,287 |
| Puerto RicoStates: 1 | $690,000 | Puerto Rico $690,000 | — |
Regions: Census Regions and Divisions of the United States (U.S. Census Bureau). www2.census.gov (external site)
Which states fall in each band
From the highest band to the lowest. The values are the same as the table on the data page.
-
$1,110,900–$1,249,1253 states
- District of Columbia $1,249,125
- Hawaii $1,110,900
- New Jersey $1,249,125
-
$787,750–$962,5502 states
- Massachusetts $962,550
- Rhode Island $787,750
-
$690,0001 state
- Puerto Rico $690,000
-
$546,250–$630,2002 states
- California $546,250
- Maryland $630,200
-
$541,28744 states
- Alabama $541,287
- Alaska $541,287
- Arizona $541,287
- Arkansas $541,287
- Colorado $541,287
- Connecticut $541,287
- Delaware $541,287
- Florida $541,287
- Georgia $541,287
- Idaho $541,287
- Illinois $541,287
- Indiana $541,287
- Iowa $541,287
- Kansas $541,287
- Kentucky $541,287
- Louisiana $541,287
- Maine $541,287
- Michigan $541,287
- Minnesota $541,287
- Mississippi $541,287
- Missouri $541,287
- Montana $541,287
- Nebraska $541,287
- Nevada $541,287
- New Hampshire $541,287
- New Mexico $541,287
- New York $541,287
- North Carolina $541,287
- North Dakota $541,287
- Ohio $541,287
- Oklahoma $541,287
- Oregon $541,287
- Pennsylvania $541,287
- South Carolina $541,287
- South Dakota $541,287
- Tennessee $541,287
- Texas $541,287
- Utah $541,287
- Vermont $541,287
- Virginia $541,287
- Washington $541,287
- West Virginia $541,287
- Wisconsin $541,287
- Wyoming $541,287
By county, state by state
Each map colors its counties on the same national scale: the same color means the same range in any state. Tap a state to open its page.
National county scale
- $541,287–$585,350
- $586,500–$649,750
- $664,700–$750,950
- $754,400–$962,550
- $977,500–$1,299,500
-
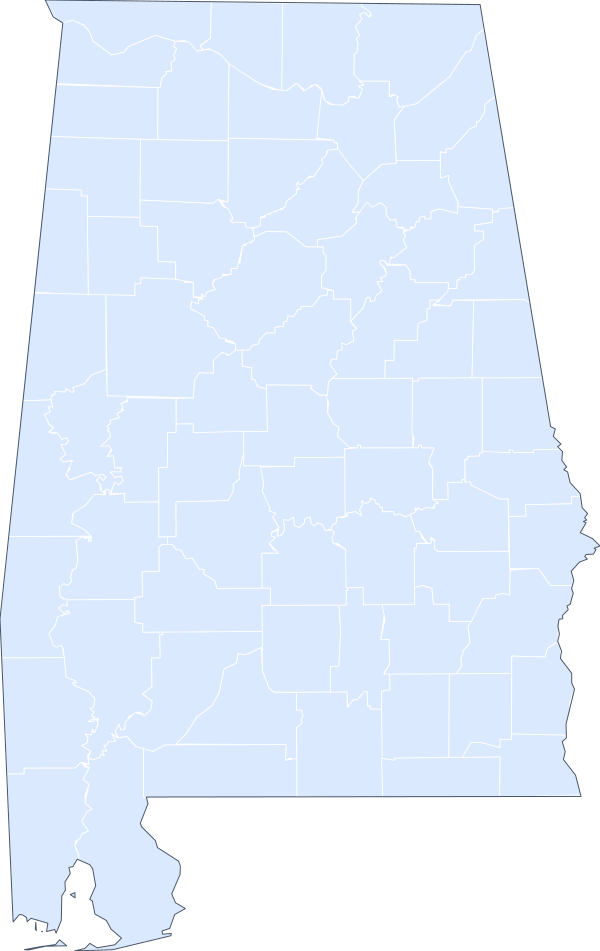 Alabama State value: $541,287 · 67 counties
-
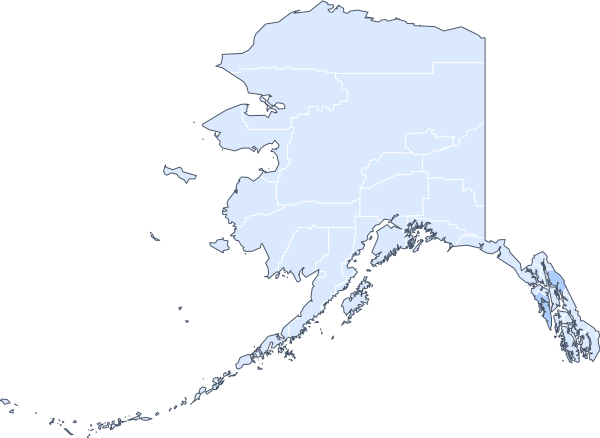 Alaska State value: $541,287 · 30 counties
-
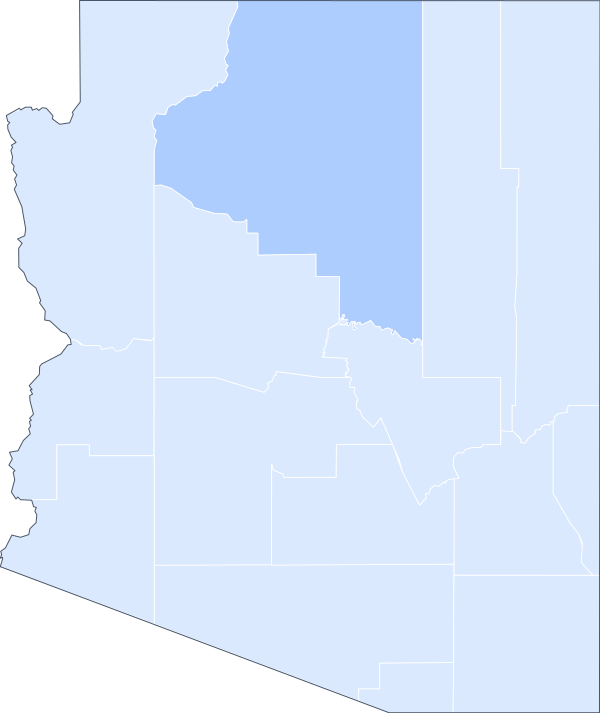 Arizona State value: $541,287 · 15 counties
-
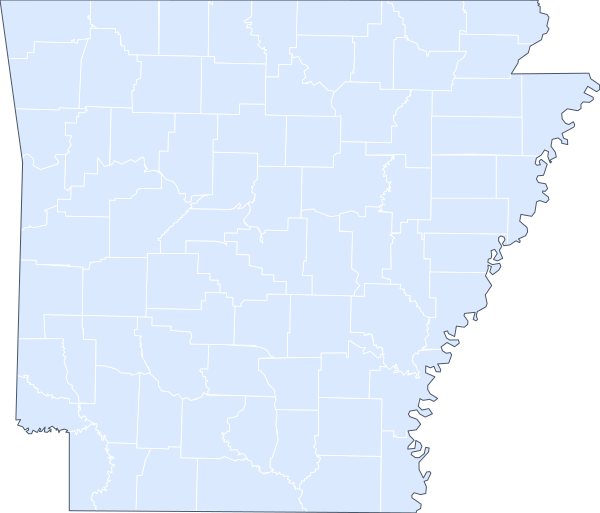 Arkansas State value: $541,287 · 75 counties
-
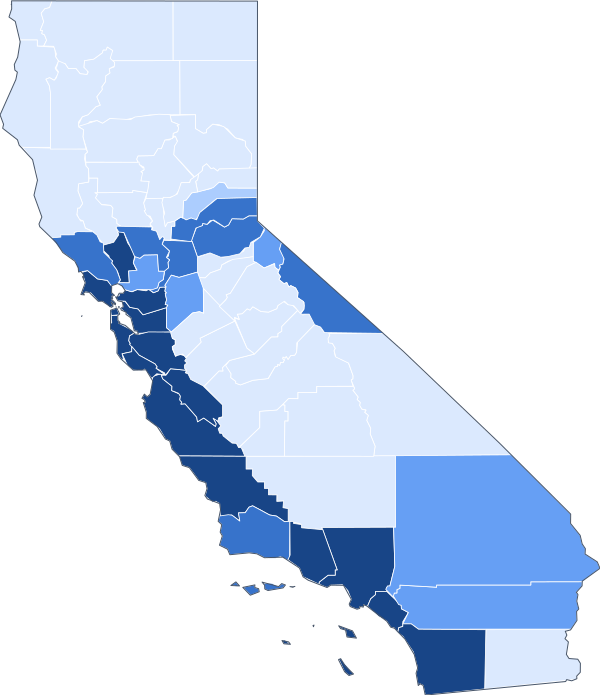 California State value: $546,250 · 58 counties
-
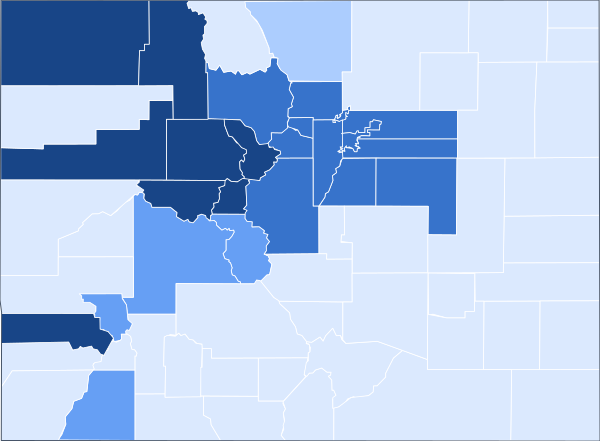 Colorado State value: $541,287 · 64 counties
-
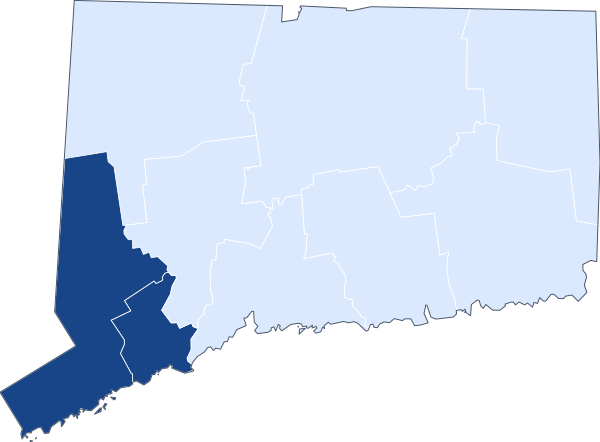 Connecticut State value: $541,287 · 9 counties
-
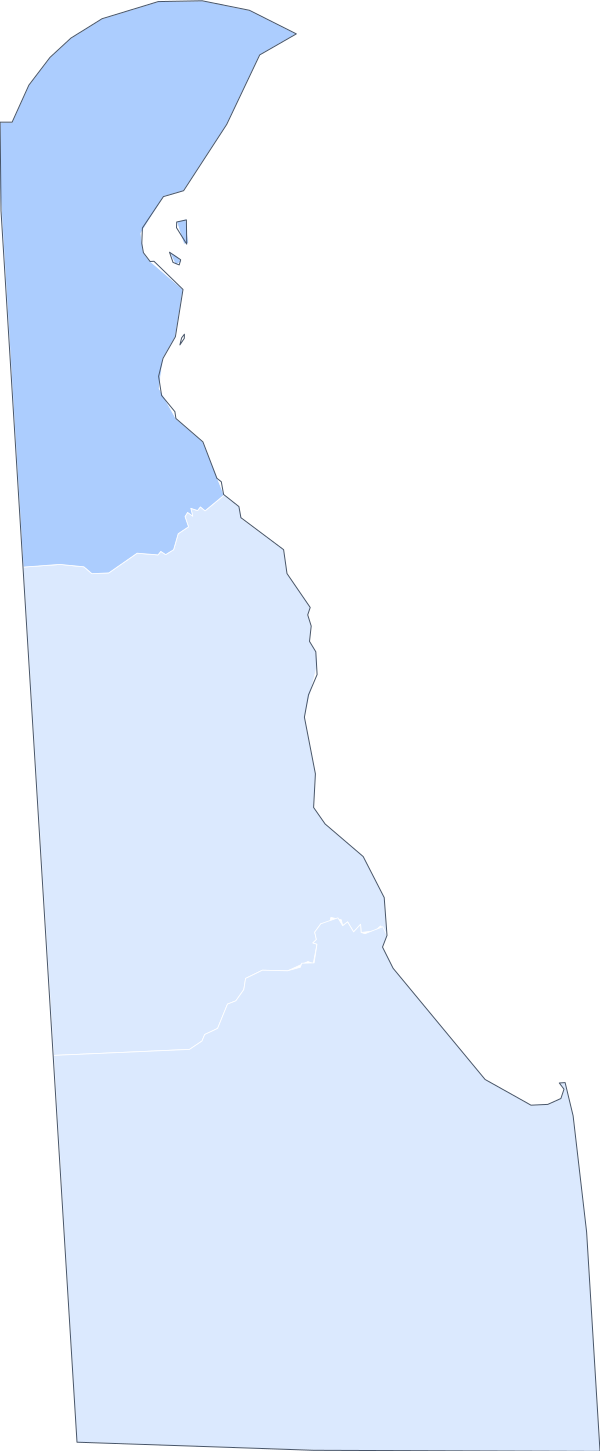 Delaware State value: $541,287 · 3 counties
-
 District of Columbia State value: $1,249,125 · 1 county
-
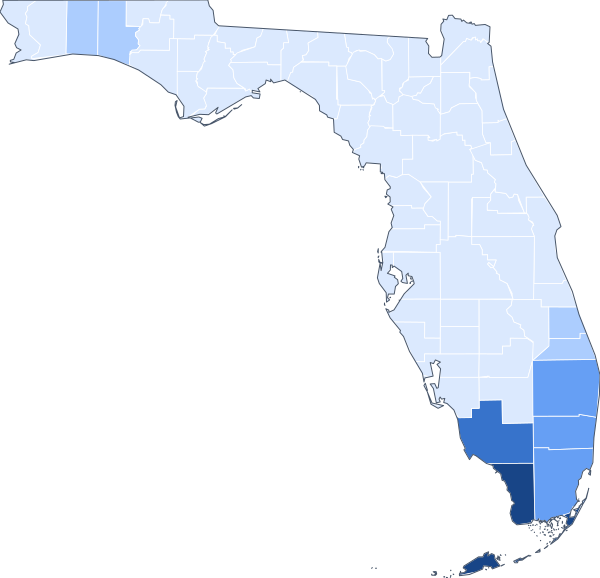 Florida State value: $541,287 · 67 counties
-
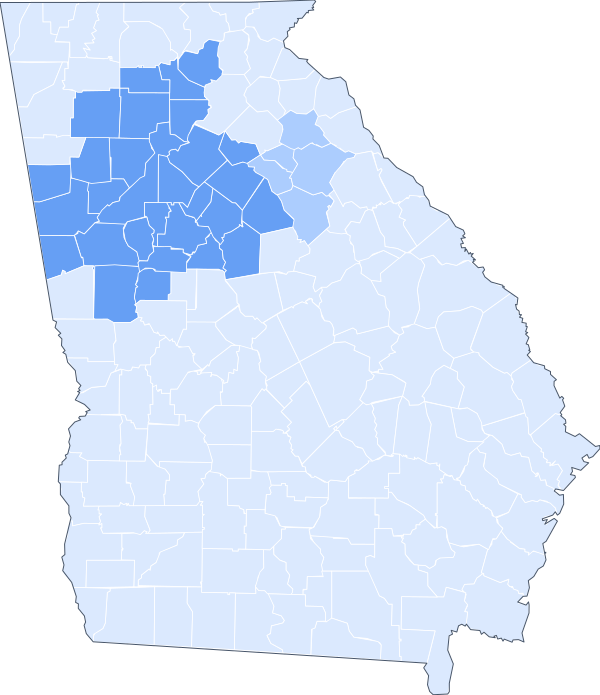 Georgia State value: $541,287 · 159 counties
-
 Hawaii State value: $1,110,900 · 5 counties
-
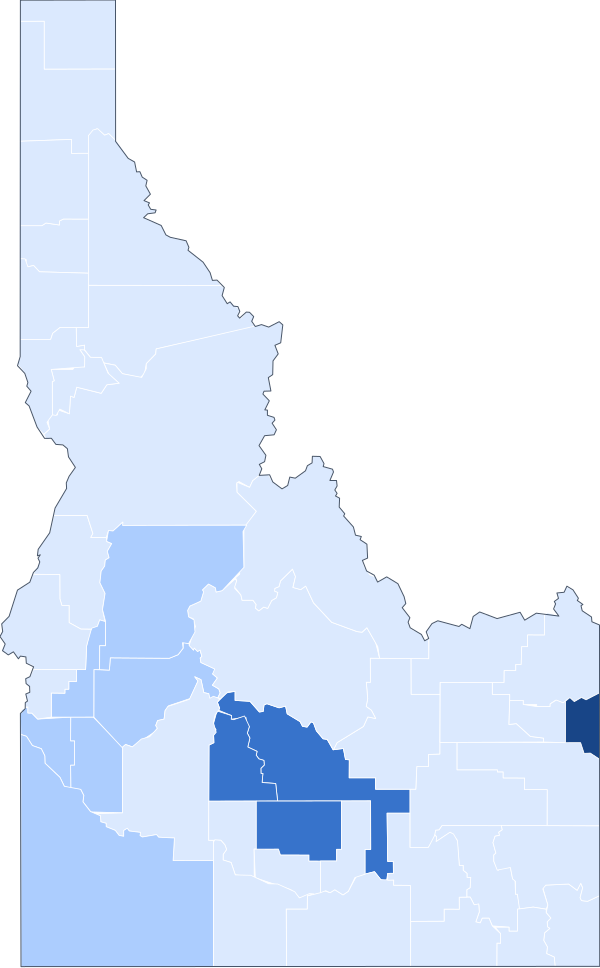 Idaho State value: $541,287 · 44 counties
-
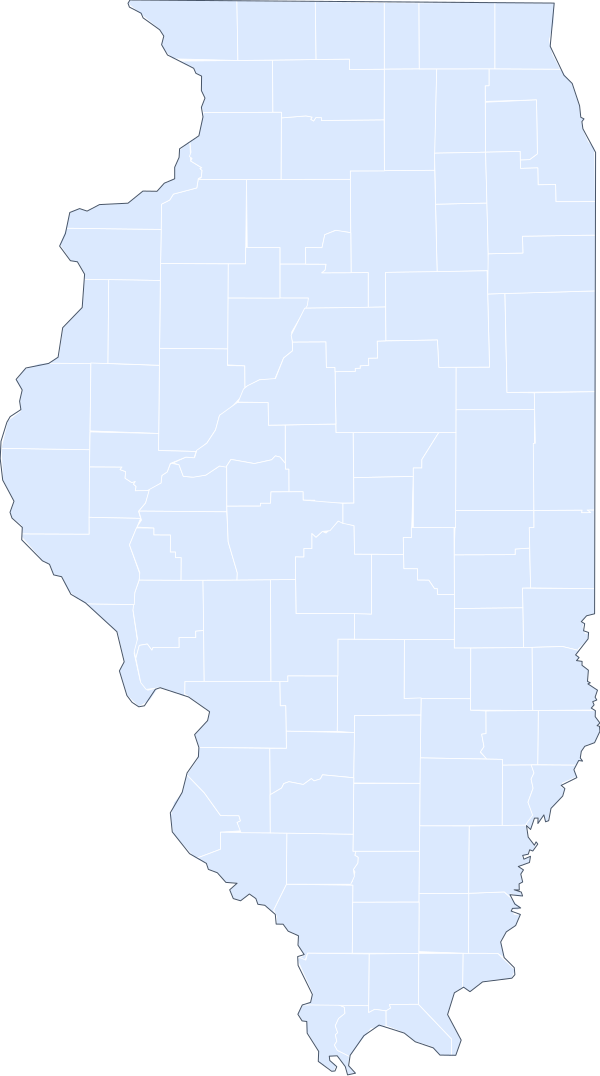 Illinois State value: $541,287 · 102 counties
-
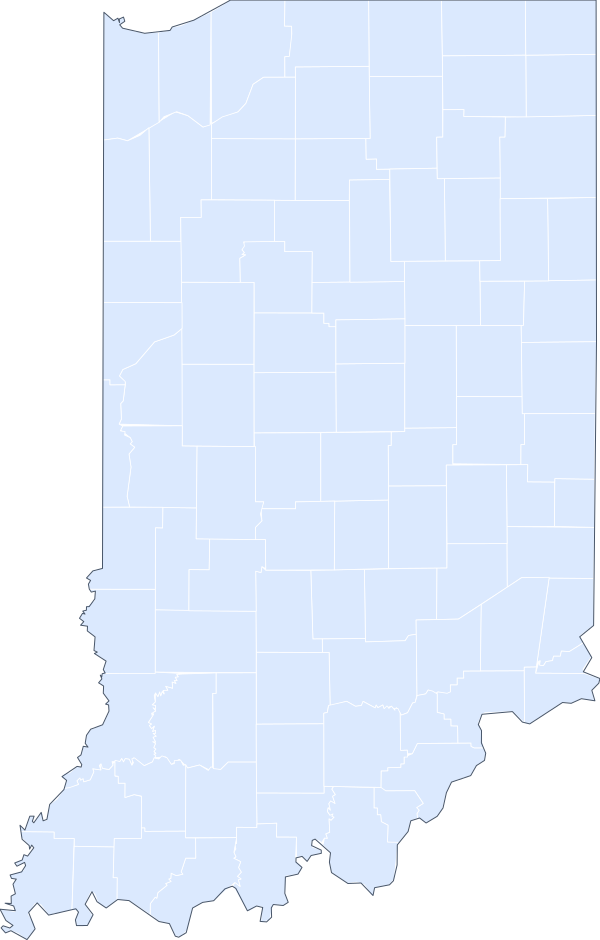 Indiana State value: $541,287 · 92 counties
-
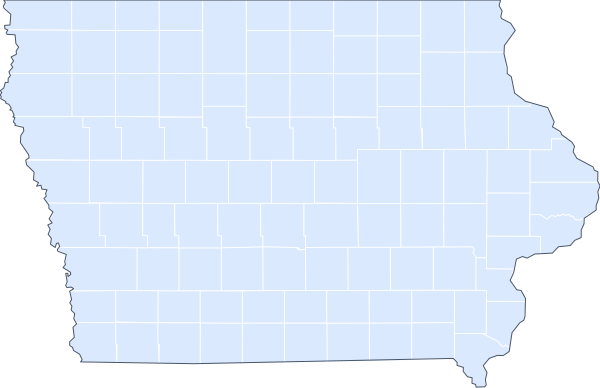 Iowa State value: $541,287 · 99 counties
-
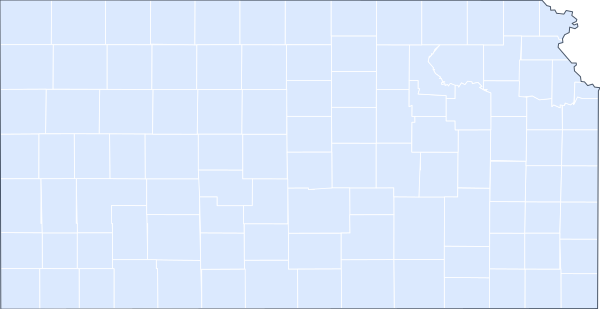 Kansas State value: $541,287 · 105 counties
-
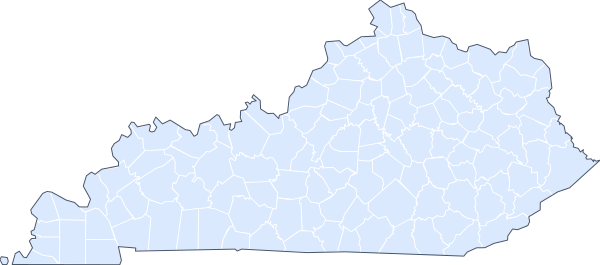 Kentucky State value: $541,287 · 120 counties
-
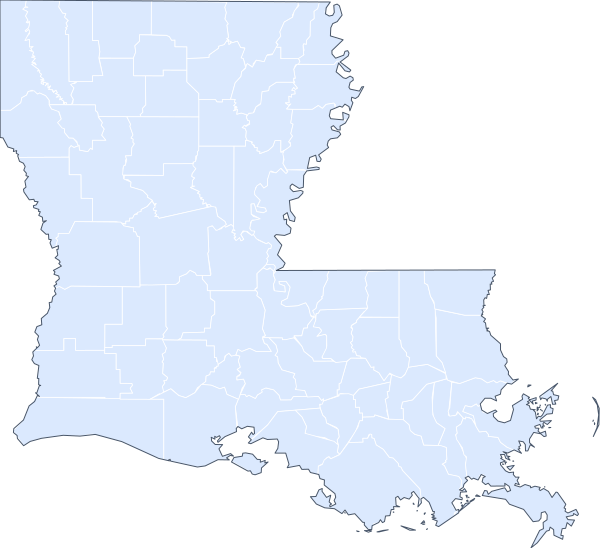 Louisiana State value: $541,287 · 64 counties
-
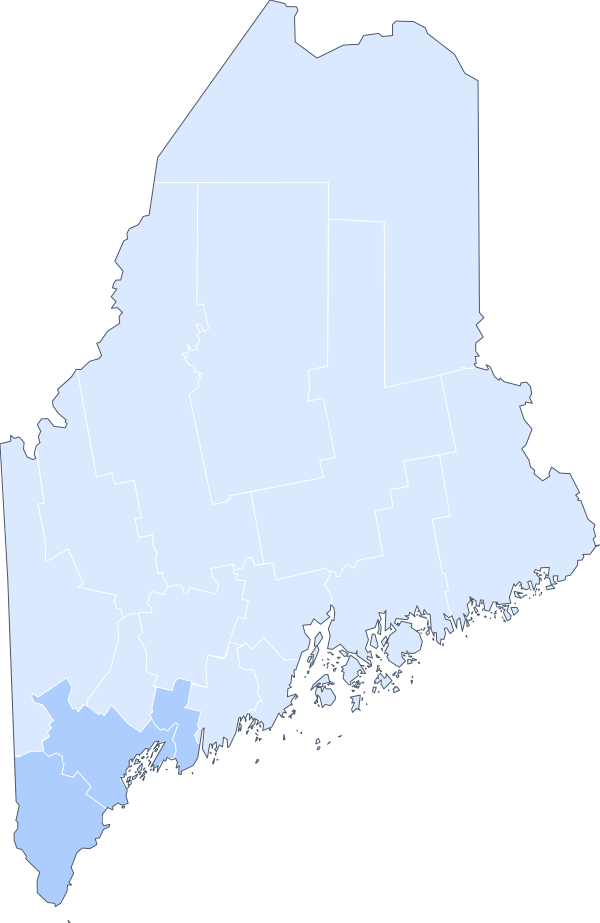 Maine State value: $541,287 · 16 counties
-
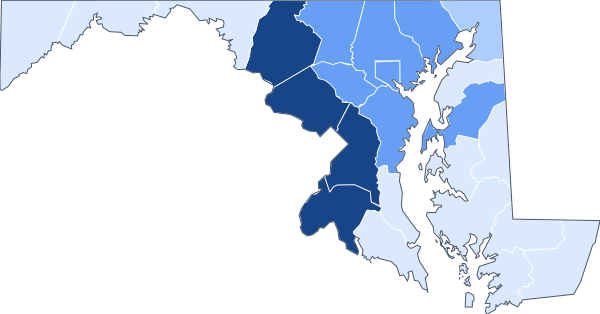 Maryland State value: $630,200 · 24 counties
-
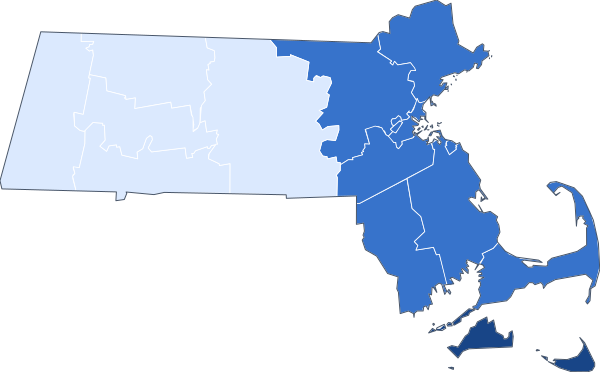 Massachusetts State value: $962,550 · 14 counties
-
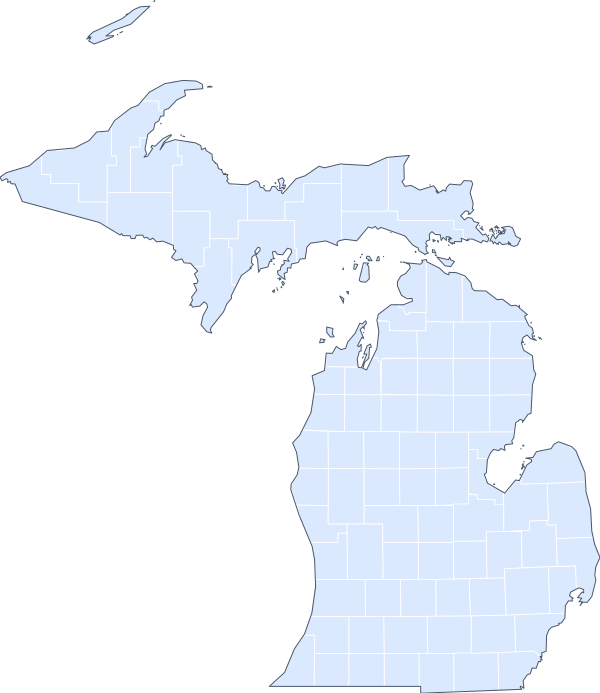 Michigan State value: $541,287 · 83 counties
-
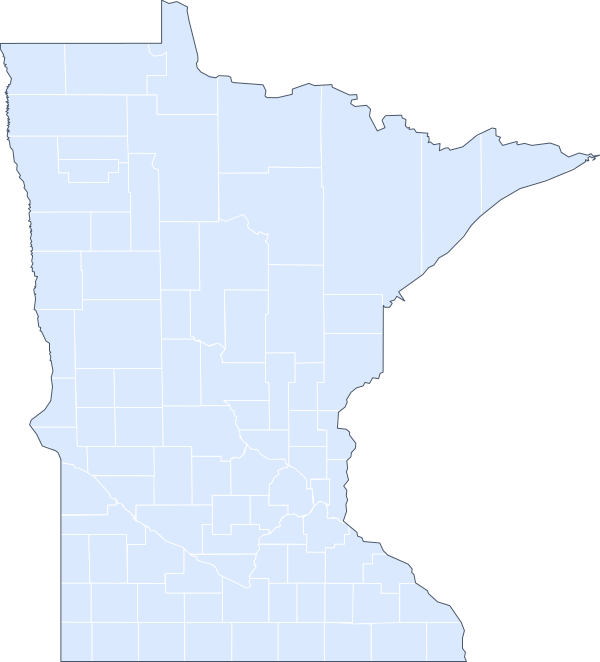 Minnesota State value: $541,287 · 87 counties
-
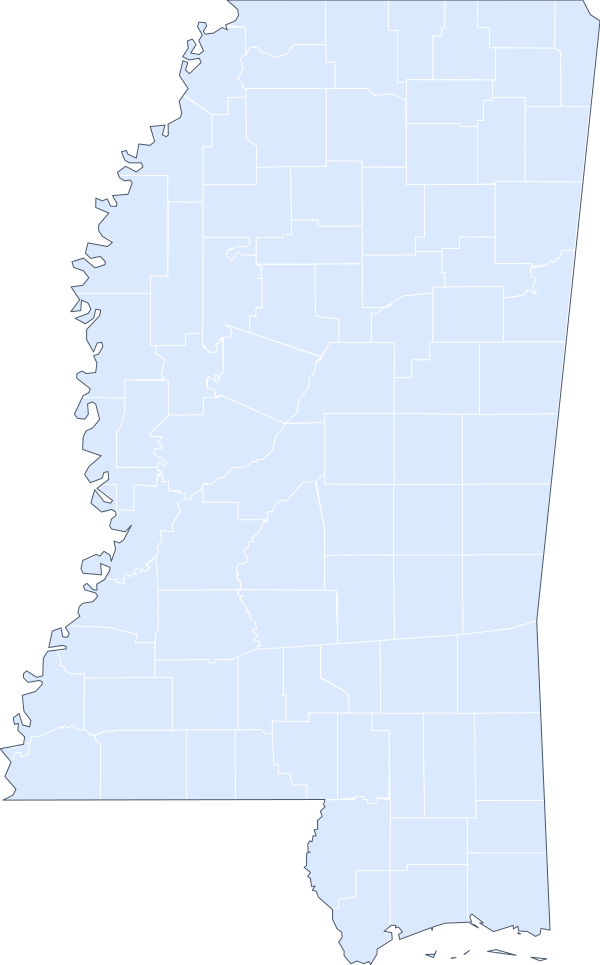 Mississippi State value: $541,287 · 82 counties
-
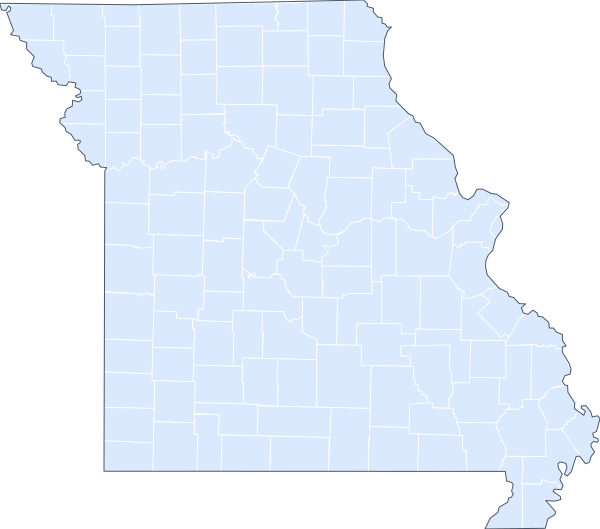 Missouri State value: $541,287 · 115 counties
-
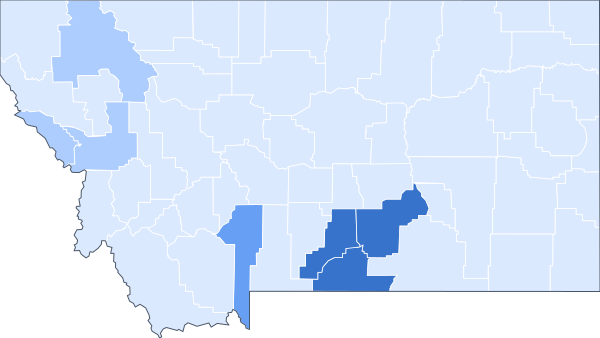 Montana State value: $541,287 · 56 counties
-
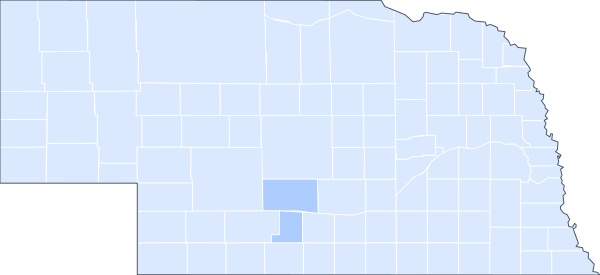 Nebraska State value: $541,287 · 93 counties
-
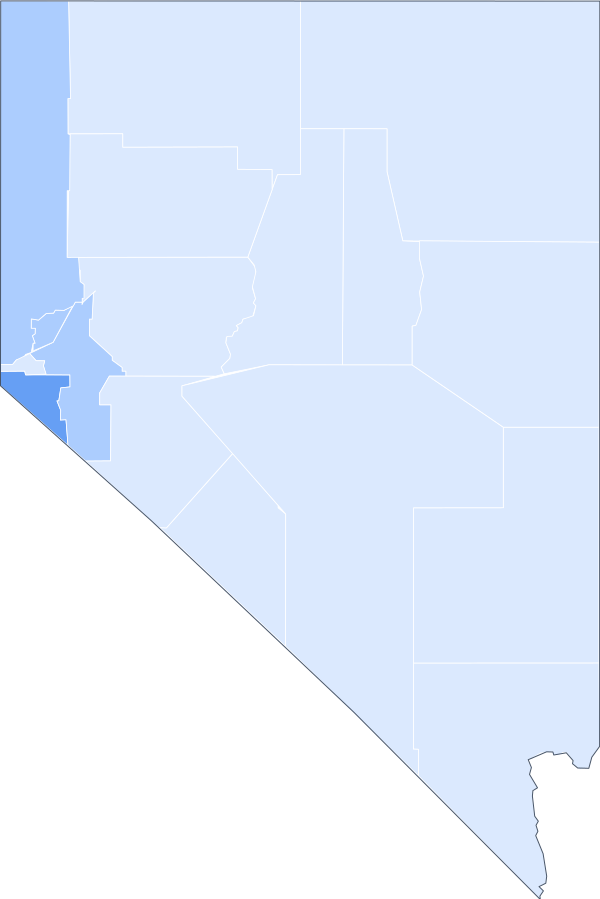 Nevada State value: $541,287 · 17 counties
-
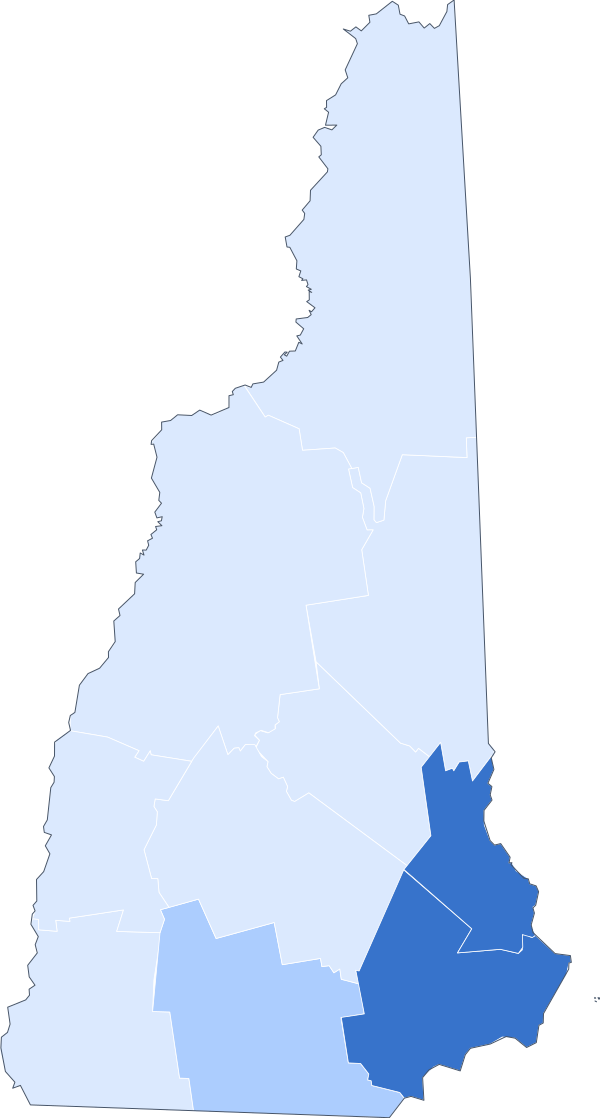 New Hampshire State value: $541,287 · 10 counties
-
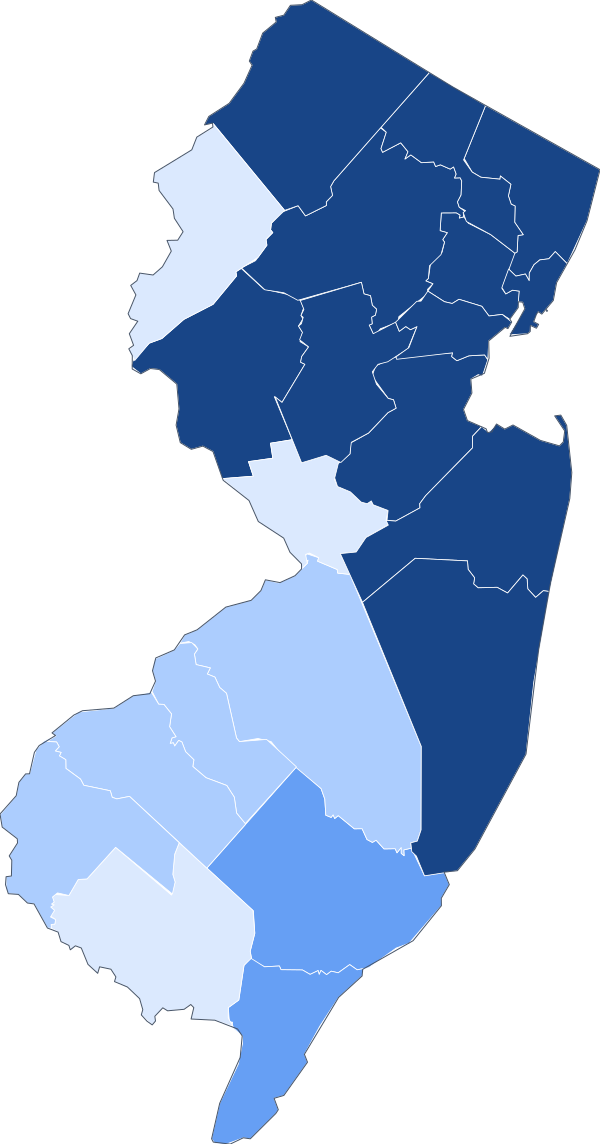 New Jersey State value: $1,249,125 · 21 counties
-
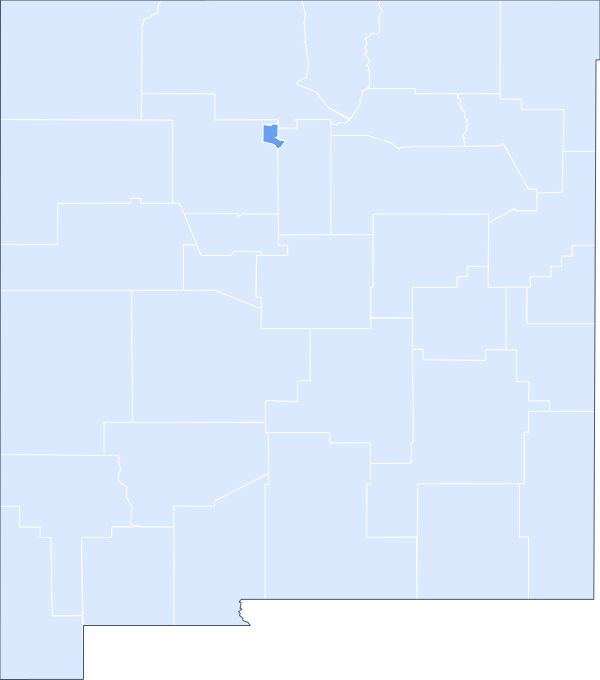 New Mexico State value: $541,287 · 33 counties
-
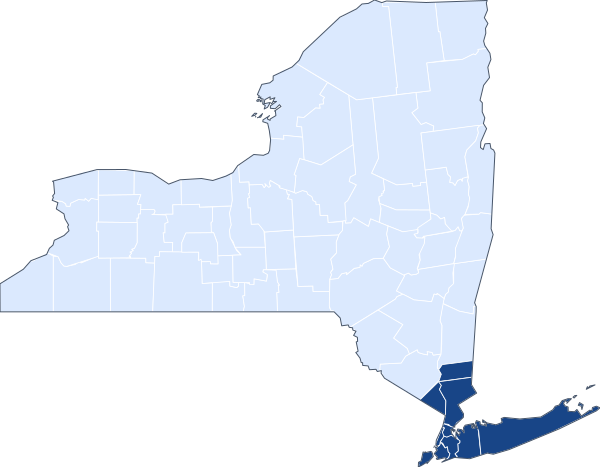 New York State value: $541,287 · 62 counties
-
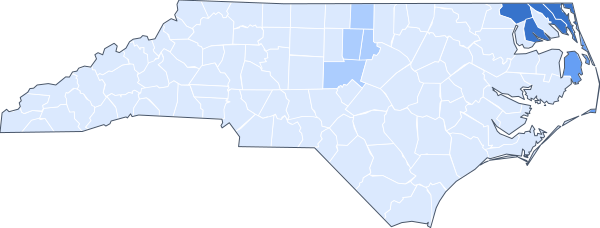 North Carolina State value: $541,287 · 100 counties
-
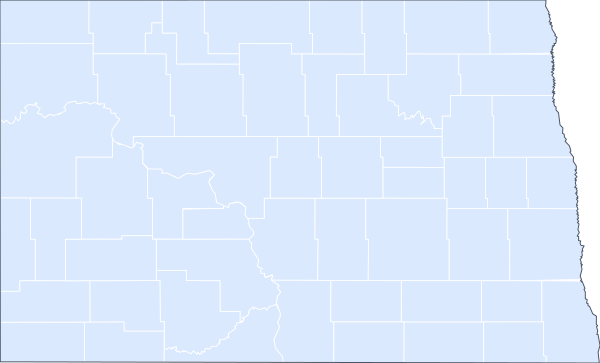 North Dakota State value: $541,287 · 53 counties
-
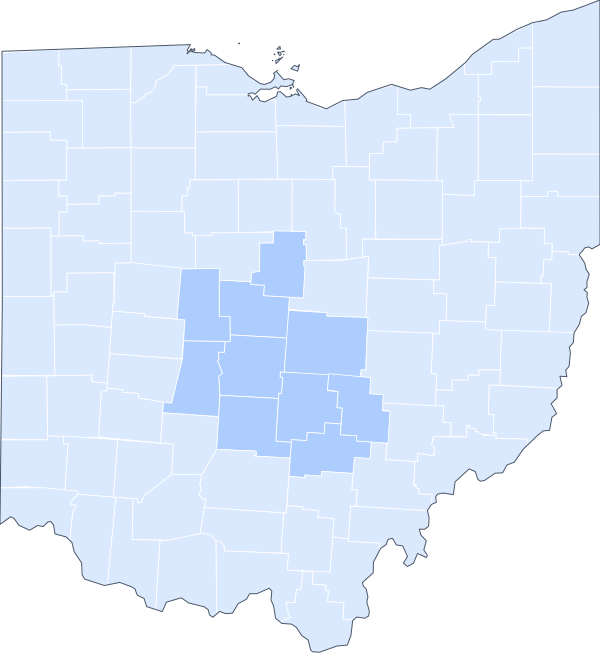 Ohio State value: $541,287 · 88 counties
-
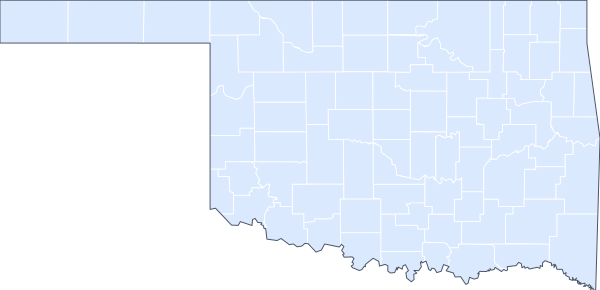 Oklahoma State value: $541,287 · 77 counties
-
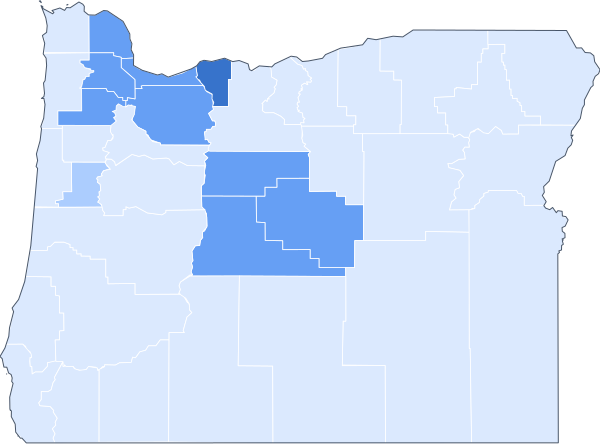 Oregon State value: $541,287 · 36 counties
-
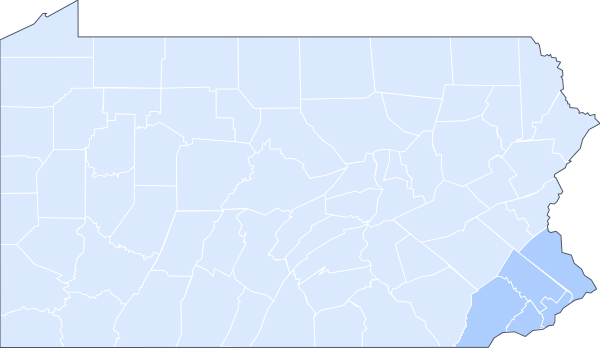 Pennsylvania State value: $541,287 · 67 counties
-
 Puerto Rico State value: $690,000 · 78 counties
-
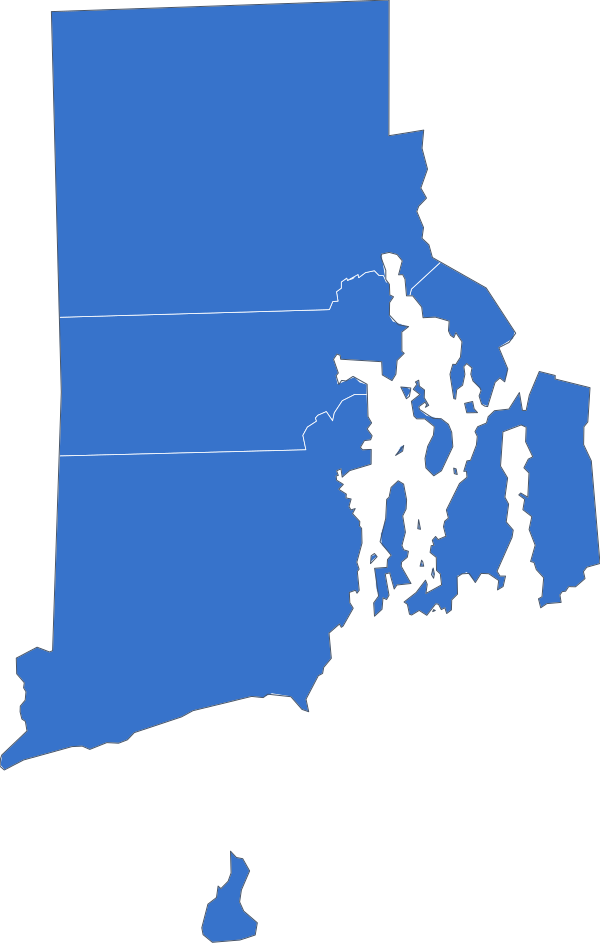 Rhode Island State value: $787,750 · 5 counties
-
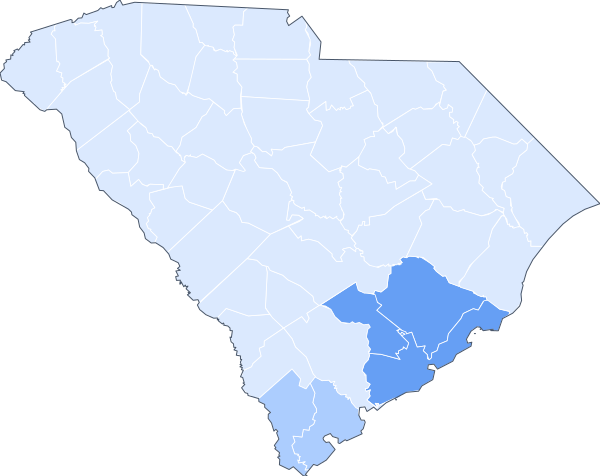 South Carolina State value: $541,287 · 46 counties
-
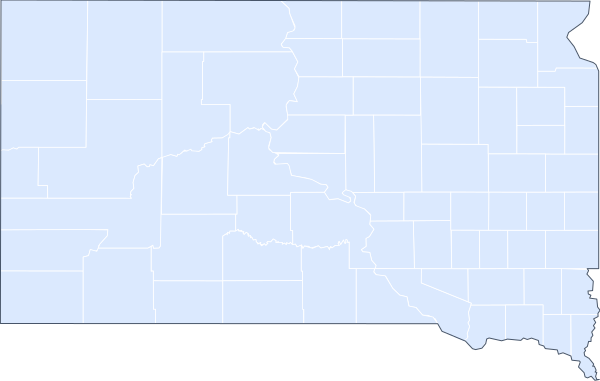 South Dakota State value: $541,287 · 66 counties
-
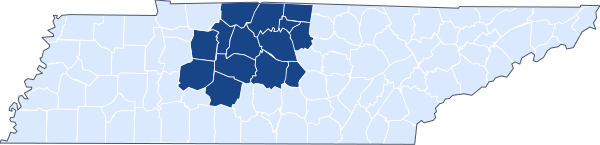 Tennessee State value: $541,287 · 95 counties
-
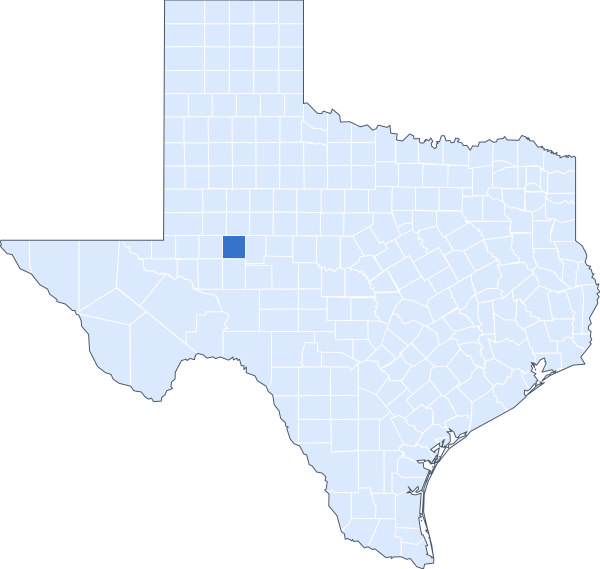 Texas State value: $541,287 · 254 counties
-
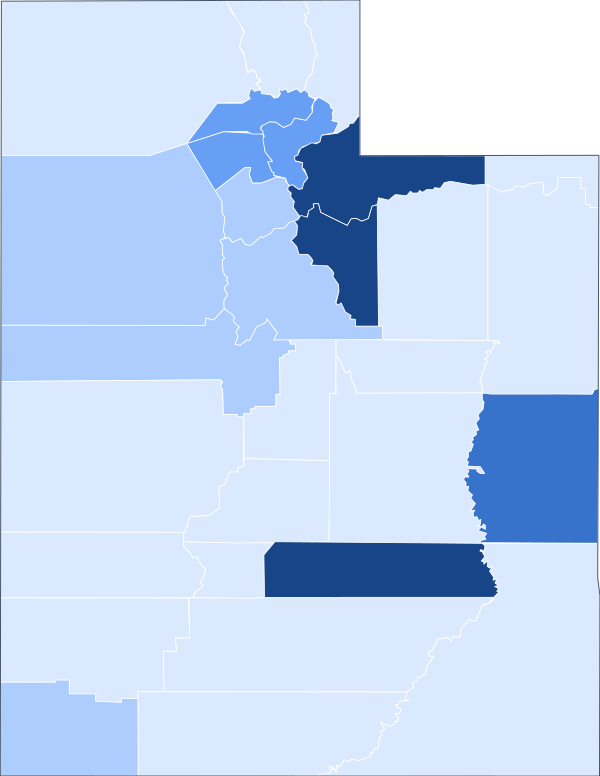 Utah State value: $541,287 · 29 counties
-
 Vermont State value: $541,287 · 14 counties
-
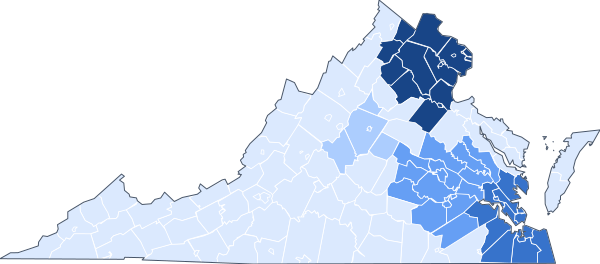 Virginia State value: $541,287 · 133 counties
-
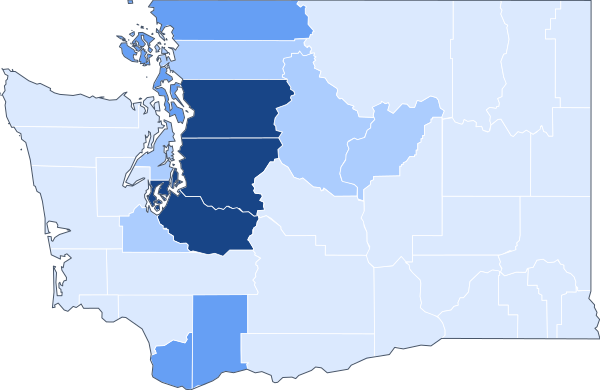 Washington State value: $541,287 · 39 counties
-
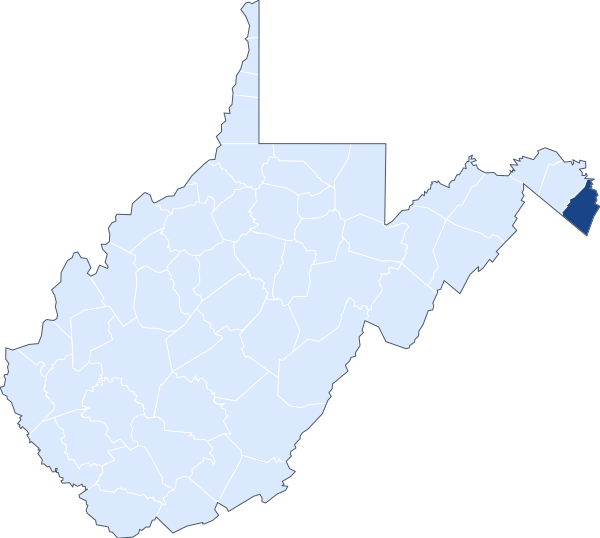 West Virginia State value: $541,287 · 55 counties
-
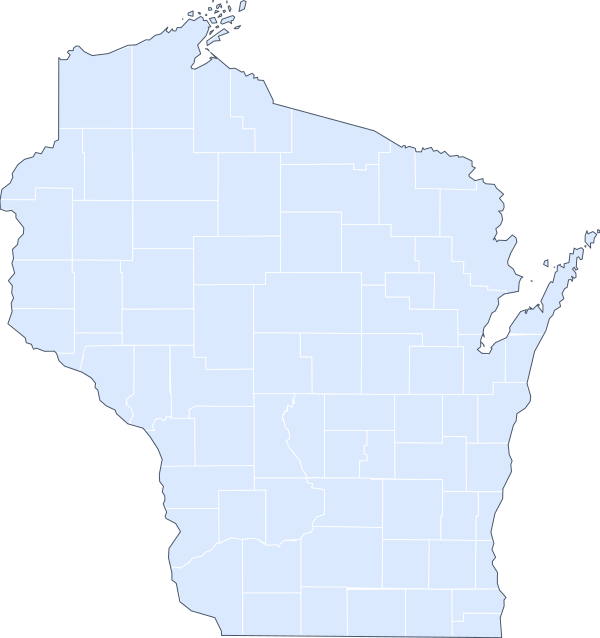 Wisconsin State value: $541,287 · 72 counties
-
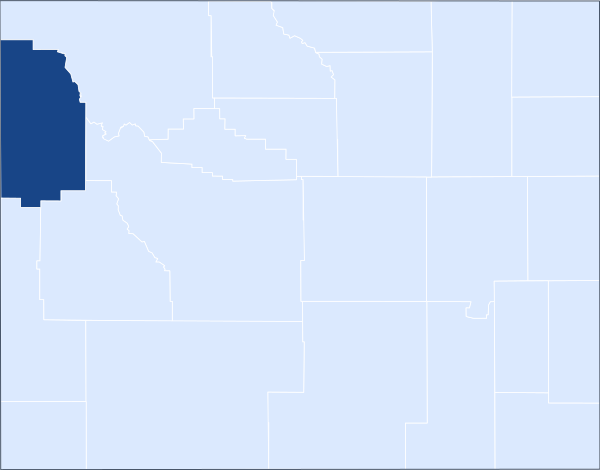 Wyoming State value: $541,287 · 23 counties
What it means for your family
Your county's FHA limit is the largest loan FHA can insure there. If the home you want costs more, you need a bigger down payment or another loan type.
How to read these maps
FHA mortgage limits · 2026 data Source: FHA mortgage limits (HUD) Data from 2026 data FHA mortgage limits (HUD) (external site)
- 1The color bands come from the distinct values of all places, so a shared minimum (like the FHA floor) does not swallow the other bands.
- 2The state map and the county maps use different scales: one compares states with each other; the others compare counties with each other.
- 3Places without data are gray: the Census does not publish some figures for very small counties.
- It caps the loan, not the price of the home: with a larger down payment you can buy a more expensive home.
- Counties in the same metropolitan area share the limit even when their prices differ.
- Alaska, Hawaii, Guam and the Virgin Islands have higher special ceilings.