Data · Freddie Mac
Mortgage rates
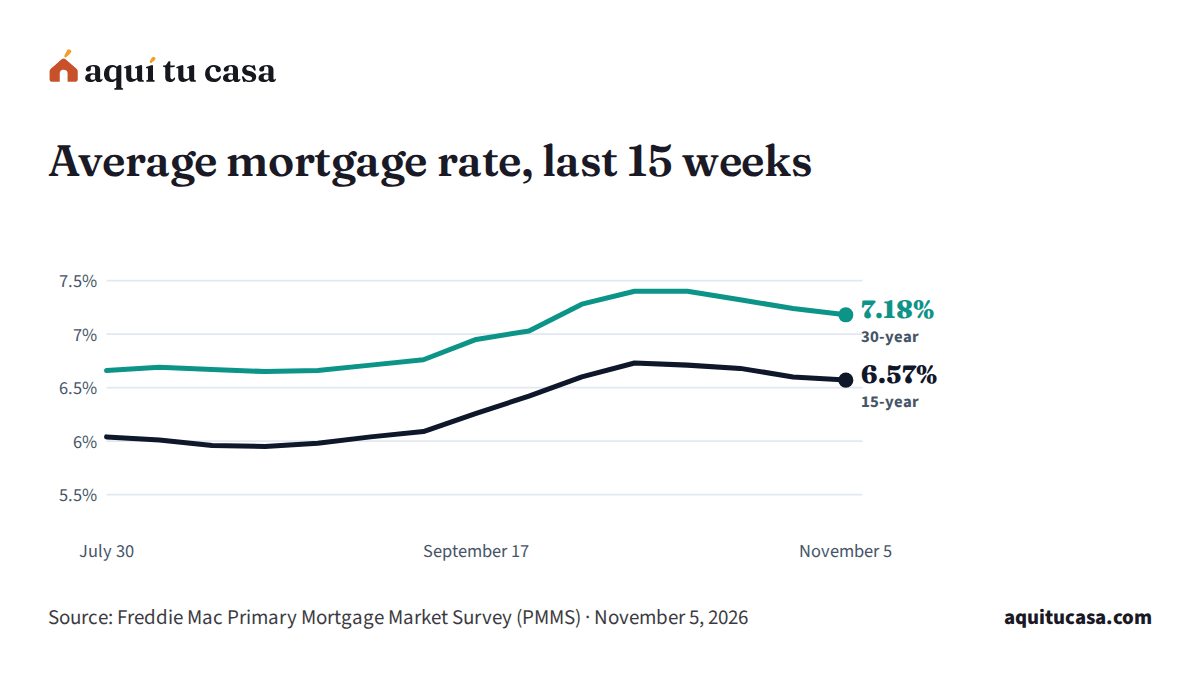
The 30-year fixed rate averaged 7.18% in the week of November 5, 2026, and the 15-year, 6.57%, according to Freddie Mac. Up 0.52 points in 15 weeks (July 30, 2026 – November 5, 2026).
Week by week
Up 0.52 points in 15 weeks (July 30, 2026 – November 5, 2026).
The key figures
- 30-year fixed
- 7.18%
- Week of November 5, 2026
- 15-year fixed
- 6.57%
- Week of November 5, 2026
- Change over 15 weeks
- +0.52
- Percentage points since July 30, 2026
Freddie Mac Primary Mortgage Market Survey · As of November 5, 2026 Source: Freddie Mac Primary Mortgage Market Survey (PMMS) As of November 5, 2026 Freddie Mac Primary Mortgage Market Survey (PMMS) (external site)
Week by week
Mortgage rates
The weekly average 30-year and 15-year fixed rate Freddie Mac publishes every Thursday.
Week by week
The weekly average 30-year and 15-year fixed rate Freddie Mac publishes every Thursday.
| November 5, 2026 | 7.18% | 6.57% |
|---|---|---|
| October 29, 2026 | 7.24% | 6.60% |
| October 22, 2026 | 7.32% | 6.68% |
| October 15, 2026 | 7.40% | 6.71% |
| October 8, 2026 | 7.40% | 6.73% |
| October 1, 2026 | 7.28% | 6.60% |
| September 24, 2026 | 7.03% | 6.42% |
| September 17, 2026 | 6.95% | 6.26% |
| September 10, 2026 | 6.76% | 6.09% |
| September 3, 2026 | 6.71% | 6.04% |
| August 27, 2026 | 6.66% | 5.98% |
| August 20, 2026 | 6.65% | 5.95% |
| August 13, 2026 | 6.67% | 5.96% |
| August 6, 2026 | 6.69% | 6.01% |
| July 30, 2026 | 6.66% | 6.04% |
- November 5, 2026 7.18%6.57%
- October 29, 2026 7.24%6.60%
- October 22, 2026 7.32%6.68%
- October 15, 2026 7.40%6.71%
- October 8, 2026 7.40%6.73%
- October 1, 2026 7.28%6.60%
- September 24, 2026 7.03%6.42%
- September 17, 2026 6.95%6.26%
- September 10, 2026 6.76%6.09%
- September 3, 2026 6.71%6.04%
- August 27, 2026 6.66%5.98%
- August 20, 2026 6.65%5.95%
- August 13, 2026 6.67%5.96%
- August 6, 2026 6.69%6.01%
- July 30, 2026 6.66%6.04%
The Freddie Mac data is downloaded from the source’s own site: its license asks to cite it and not alter it.
Freddie Mac Primary Mortgage Market Survey · As of November 5, 2026 Source: Freddie Mac Primary Mortgage Market Survey (PMMS) As of November 5, 2026 Freddie Mac Primary Mortgage Market Survey (PMMS) (external site)
Official source
Methodology: where this number comes from
The source, the data date, how we compute it and what to know before you use it.
About this measure
- Published by
- Freddie Mac
- Type
- Source figure, unchanged
- Data date
- As of November 5, 2026
- Geography
- United States (national average)
- Unit
- Percentage
- Updated
- Every Thursday
- License
- Use with attribution, unaltered
Before you use this number
It is a national weekly average for buyers with excellent credit and a large down payment; your rate depends on your credit, your down payment, the loan type and the lender.
It excludes points, fees and the cost of mortgage insurance. Compare offers by APR, not by the rate alone.
The site’s calculators start from this rate and its date; replace it with the rate you are offered.
Freddie Mac Primary Mortgage Market Survey (PMMS)
Freddie Mac
- Current version
- As of November 5, 2026
- As of
- November 5, 2026
- Retrieved by us
- November 6, 2026
- Next update
- Every Thursday
- License
- Use with attribution, unaltered
Guides that explain this number
-
Buying a home
Mortgage interest rates: fixed, adjustable, points and APR
What your mortgage rate is and what moves it, how fixed and adjustable rates differ, and how points, the APR and rate locks work.
-
Buying a home
How to compare Loan Estimates, page by page
How to read and compare two or three Loan Estimates side by side: what to check on each page, what can change and how to negotiate with lenders.
-
Mortgage loans
Refinancing your mortgage: types, costs and break-even
Refinancing explained: rate-and-term vs cash-out, closing costs, the break-even point and FHA and VA streamline refinances.
Other data in this group
The other measures in this group, with the U.S. figure.
-
FHA loan limit (1 unit)
$541,287The largest loan the FHA insures for a one-unit home in each county.
-
Conforming loan limit (1 unit)
$832,750The largest loan Fannie Mae and Freddie Mac buy for a one-unit home; above it, a loan is “jumbo”.
Find it in your county
Every county and municipality has its page with this number, the other indicators and free help near you.
Your saved place