Places
Data from November 2026
The counties of California
California has 58 counties. The most populous is Los Angeles County (9,808,667 people); the most expensive homes are in San Mateo County ($1,559,600) and the least expensive in Modoc County ($224,700). Each has its own page with prices, limits and help nearby.

Key numbers in California
- Counties
- 58
- each with its own page
- People
- 39.3M
- Census, Average 2020–2024
- Typical home
- $734,700
- median value in California
Map and extremes
Where it costs more and less in California
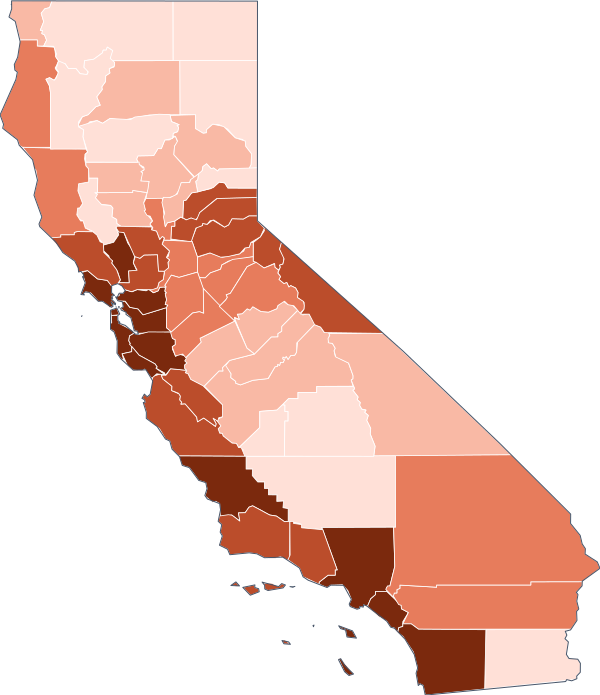
Typical home value by county
- Under $342,000
- $342,000–$433,200
- $433,200–$590,200
- $590,200–$824,700
- $824,700 or more
-
People
- Highest
- 9,808,667
- Los Angeles County
- Lowest
- 1,616
- Alpine County
-
Typical home
- Highest
- $1,559,600
- San Mateo County
- Lowest
- $224,700
- Modoc County
-
Typical rent
- Highest
- $2,922
- San Mateo County
- Lowest
- $836
- Modoc County
-
FHA limit
- Highest
- $1,249,125
- Alameda County
- Lowest
- $541,287
- Yuba County
The full list
Every county in California
Type a name to filter or tap a column to sort. Each county links to its page.
| Los Angeles County | 9,808,667 | $834,200 | $1,954 | $90,112 | $1,249,125 |
|---|---|---|---|---|---|
| San Diego County | 3,288,774 | $854,700 | $2,246 | $106,268 | $1,104,000 |
| Orange County | 3,165,820 | $962,600 | $2,434 | $116,289 | $1,249,125 |
| Riverside County | 2,478,600 | $557,300 | $1,901 | $93,074 | $690,000 |
| San Bernardino County | 2,197,104 | $505,000 | $1,801 | $85,478 | $690,000 |
| Santa Clara County | 1,902,047 | $1,490,600 | $2,857 | $164,281 | $1,249,125 |
| Alameda County | 1,649,473 | $1,090,100 | $2,357 | $129,367 | $1,249,125 |
| Sacramento County | 1,594,006 | $534,200 | $1,790 | $92,175 | $764,750 |
| Contra Costa County | 1,165,012 | $866,800 | $2,375 | $127,229 | $1,249,125 |
| Fresno County | 1,016,725 | $388,800 | $1,392 | $74,201 | $541,287 |
| Kern County | 915,075 | $338,300 | $1,300 | $70,210 | $541,287 |
| Ventura County | 837,469 | $822,700 | $2,317 | $109,797 | $1,035,000 |
| San Francisco County | 830,235 | $1,394,500 | $2,476 | $140,970 | $1,249,125 |
| San Joaquin County | 797,334 | $530,700 | $1,734 | $92,179 | $678,500 |
| San Mateo County | 742,340 | $1,559,600 | $2,922 | $158,855 | $1,249,125 |
| Stanislaus County | 553,990 | $450,100 | $1,623 | $81,468 | $545,100 |
| Sonoma County | 485,040 | $815,500 | $2,158 | $104,674 | $897,000 |
| Tulare County | 478,693 | $330,100 | $1,280 | $71,300 | $541,287 |
| Solano County | 451,918 | $617,700 | $2,163 | $100,401 | $685,400 |
| Santa Barbara County | 443,701 | $790,700 | $2,131 | $98,161 | $941,850 |
| Monterey County | 437,613 | $781,000 | $2,055 | $97,230 | $994,750 |
| Placer County | 419,156 | $688,100 | $2,069 | $115,998 | $764,750 |
| Merced County | 290,201 | $391,800 | $1,343 | $65,510 | $541,287 |
| San Luis Obispo County | 281,555 | $824,700 | $1,992 | $97,446 | $1,000,500 |
| Santa Cruz County | 264,926 | $1,027,500 | $2,264 | $111,093 | $1,249,125 |
| Marin County | 257,969 | $1,507,300 | $2,668 | $149,091 | $1,249,125 |
| Yolo County | 220,564 | $620,700 | $1,857 | $91,752 | $764,750 |
| Butte County | 207,929 | $424,700 | $1,414 | $67,928 | $541,287 |
| El Dorado County | 192,662 | $679,900 | $1,715 | $108,845 | $764,750 |
| Shasta County | 181,436 | $366,400 | $1,317 | $72,636 | $541,287 |
| Imperial County | 180,202 | $309,600 | $1,056 | $57,681 | $541,287 |
| Madera County | 160,940 | $393,200 | $1,390 | $76,627 | $541,287 |
| Kings County | 153,298 | $324,300 | $1,331 | $70,995 | $541,287 |
| Napa County | 134,869 | $869,500 | $2,237 | $111,471 | $1,017,750 |
| Humboldt County | 134,541 | $446,900 | $1,287 | $61,160 | $541,287 |
| Nevada County | 102,481 | $621,800 | $1,677 | $89,882 | $649,750 |
| Sutter County | 98,857 | $433,500 | $1,439 | $79,704 | $541,287 |
| Mendocino County | 90,244 | $512,200 | $1,317 | $68,092 | $546,250 |
| Yuba County | 84,507 | $412,300 | $1,311 | $76,373 | $541,287 |
| Lake County | 68,152 | $324,300 | $1,368 | $60,621 | $541,287 |
| San Benito County | 67,290 | $793,400 | $1,992 | $114,394 | $1,249,125 |
| Tehama County | 65,167 | $339,600 | $1,184 | $63,784 | $541,287 |
| Tuolumne County | 54,498 | $433,200 | $1,302 | $77,404 | $541,287 |
| Calaveras County | 46,248 | $457,200 | $1,625 | $78,647 | $541,287 |
| Siskiyou County | 43,466 | $309,500 | $1,091 | $59,095 | $541,287 |
| Amador County | 41,428 | $449,800 | $1,421 | $88,044 | $541,287 |
| Lassen County | 30,356 | $265,300 | $1,000 | $67,403 | $541,287 |
| Glenn County | 28,494 | $352,400 | $1,120 | $67,139 | $541,287 |
| Del Norte County | 27,107 | $342,000 | $1,233 | $67,058 | $541,287 |
| Colusa County | 21,984 | $393,400 | $1,157 | $75,672 | $541,287 |
| Plumas County | 19,423 | $360,200 | $1,194 | $66,031 | $541,287 |
| Inyo County | 18,739 | $348,700 | $1,189 | $73,991 | $541,287 |
| Mariposa County | 17,082 | $387,900 | $1,305 | $68,412 | $541,287 |
| Trinity County | 15,860 | $325,800 | $1,073 | $53,002 | $541,287 |
| Mono County | 13,148 | $639,400 | $1,629 | $99,415 | $776,250 |
| Modoc County | 8,600 | $224,700 | $836 | $59,455 | $541,287 |
| Sierra County | 2,746 | $331,900 | — | $63,355 | $541,287 |
| Alpine County | 1,616 | $590,200 | — | $105,521 | $736,000 |
- Los Angeles $834,200$1,249,125
- San Diego $854,700$1,104,000
- Orange $962,600$1,249,125
- Riverside $557,300$690,000
- San Bernardino $505,000$690,000
- Santa Clara $1,490,600$1,249,125
- Alameda $1,090,100$1,249,125
- Sacramento $534,200$764,750
- Contra Costa $866,800$1,249,125
- Fresno $388,800$541,287
- Kern $338,300$541,287
- Ventura $822,700$1,035,000
- San Francisco $1,394,500$1,249,125
- San Joaquin $530,700$678,500
- San Mateo $1,559,600$1,249,125
- Stanislaus $450,100$545,100
- Sonoma $815,500$897,000
- Tulare $330,100$541,287
- Solano $617,700$685,400
- Santa Barbara $790,700$941,850
- Monterey $781,000$994,750
- Placer $688,100$764,750
- Merced $391,800$541,287
- San Luis Obispo $824,700$1,000,500
- Santa Cruz $1,027,500$1,249,125
- Marin $1,507,300$1,249,125
- Yolo $620,700$764,750
- Butte $424,700$541,287
- El Dorado $679,900$764,750
- Shasta $366,400$541,287
- Imperial $309,600$541,287
- Madera $393,200$541,287
- Kings $324,300$541,287
- Napa $869,500$1,017,750
- Humboldt $446,900$541,287
- Nevada $621,800$649,750
- Sutter $433,500$541,287
- Mendocino $512,200$546,250
- Yuba $412,300$541,287
- Lake $324,300$541,287
- San Benito $793,400$1,249,125
- Tehama $339,600$541,287
- Tuolumne $433,200$541,287
- Calaveras $457,200$541,287
- Siskiyou $309,500$541,287
- Amador $449,800$541,287
- Lassen $265,300$541,287
- Glenn $352,400$541,287
- Del Norte $342,000$541,287
- Colusa $393,400$541,287
- Plumas $360,200$541,287
- Inyo $348,700$541,287
- Mariposa $387,900$541,287
- Trinity $325,800$541,287
- Mono $639,400$776,250
- Modoc $224,700$541,287
- Sierra $331,900$541,287
- Alpine $590,200$736,000
Census medians; FHA limit for one unit. · American Community Survey · Average 2020–2024 · FHA mortgage limits · 2026 data Source: American Community Survey (ACS) 5-year estimates Average 2020–2024 American Community Survey (ACS) 5-year estimates (external site)
Frequently asked questions
How many counties does California have?
California has 58 counties. The most populous is Los Angeles County (9,808,667 people) and the least populous Alpine County (1,616), per the Census (Average 2020–2024).
Which county in California has the most expensive homes?
By typical value (Average 2020–2024, Census), the most expensive is San Mateo County ($1,559,600) and the least expensive Modoc County ($224,700).
Where is rent highest in California?
The highest typical rent is in San Mateo County ($2,922 a month) and the lowest in Modoc County ($836), per the Census (Average 2020–2024).
Which county in California has the highest FHA limit?
In 2026 data, the highest FHA limit for one unit is in Alameda County ($1,249,125). 28 counties are at the lowest, $541,287.